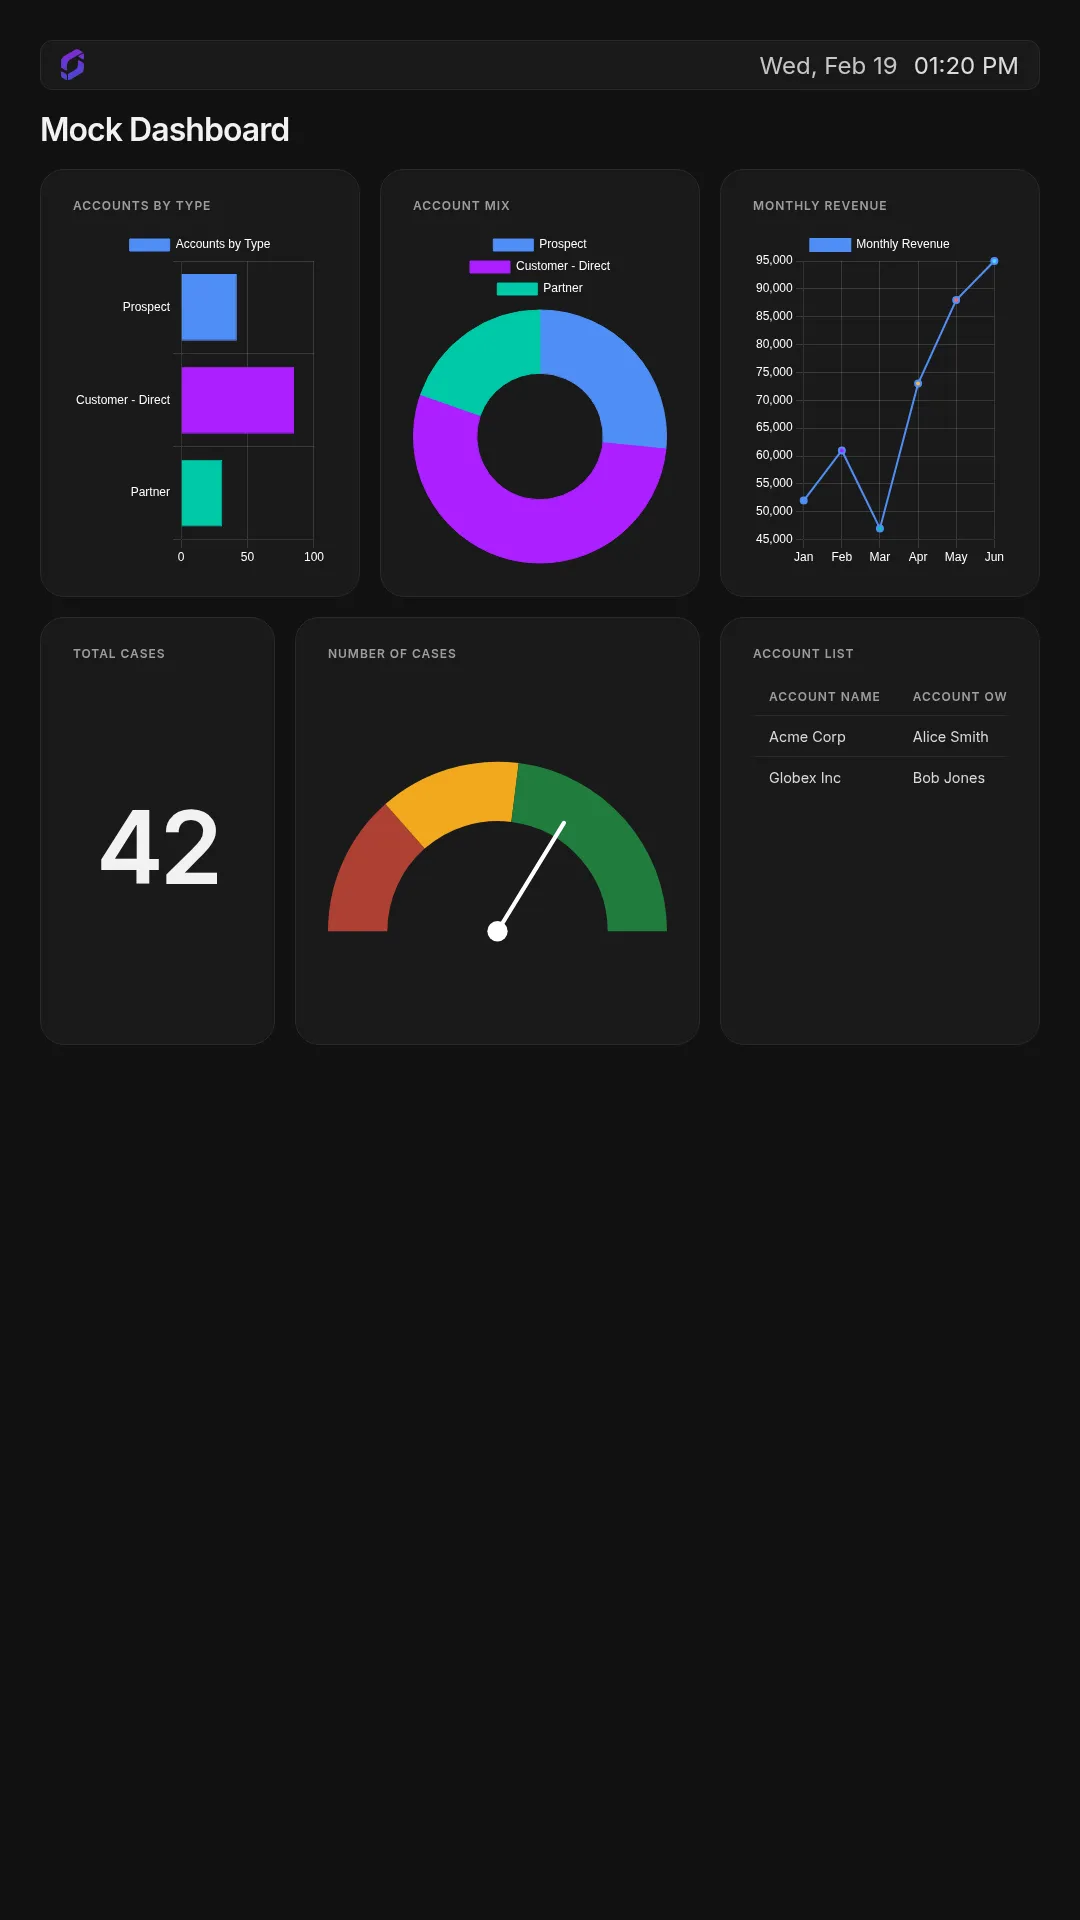
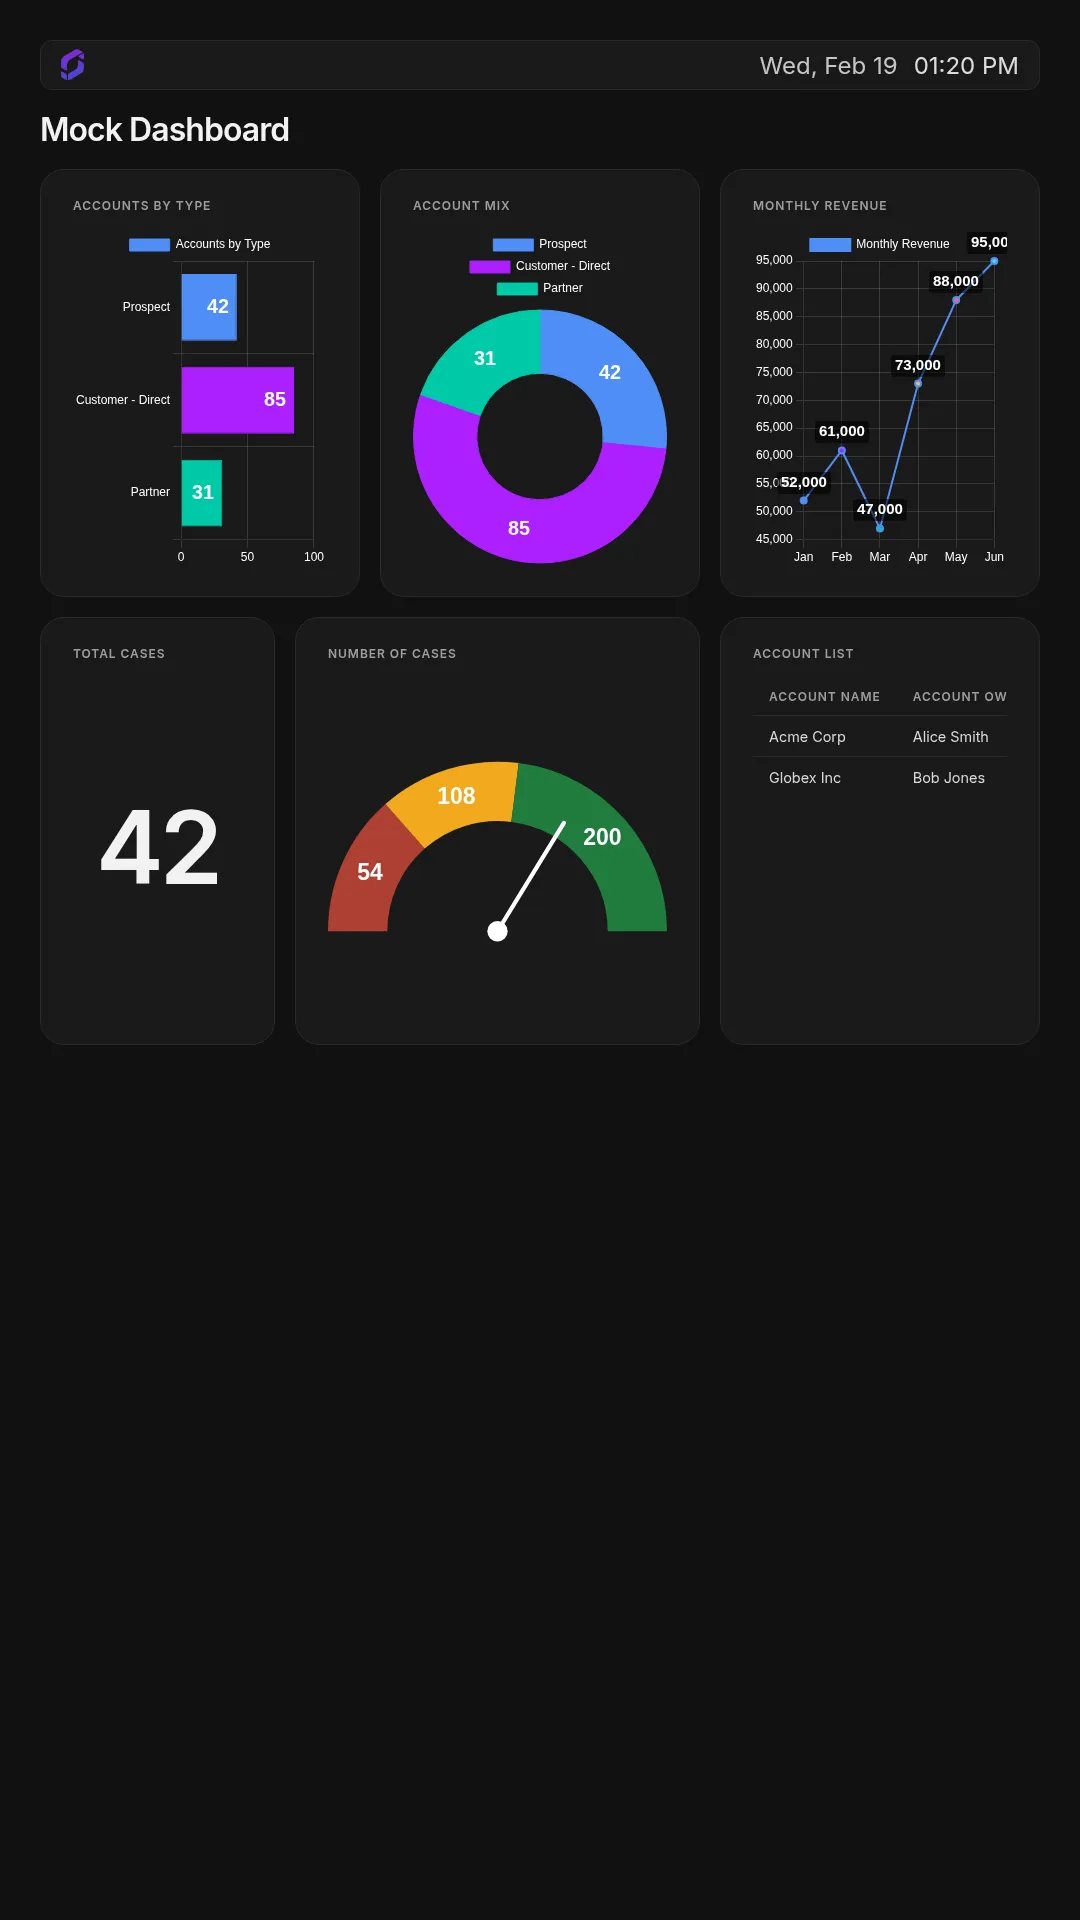
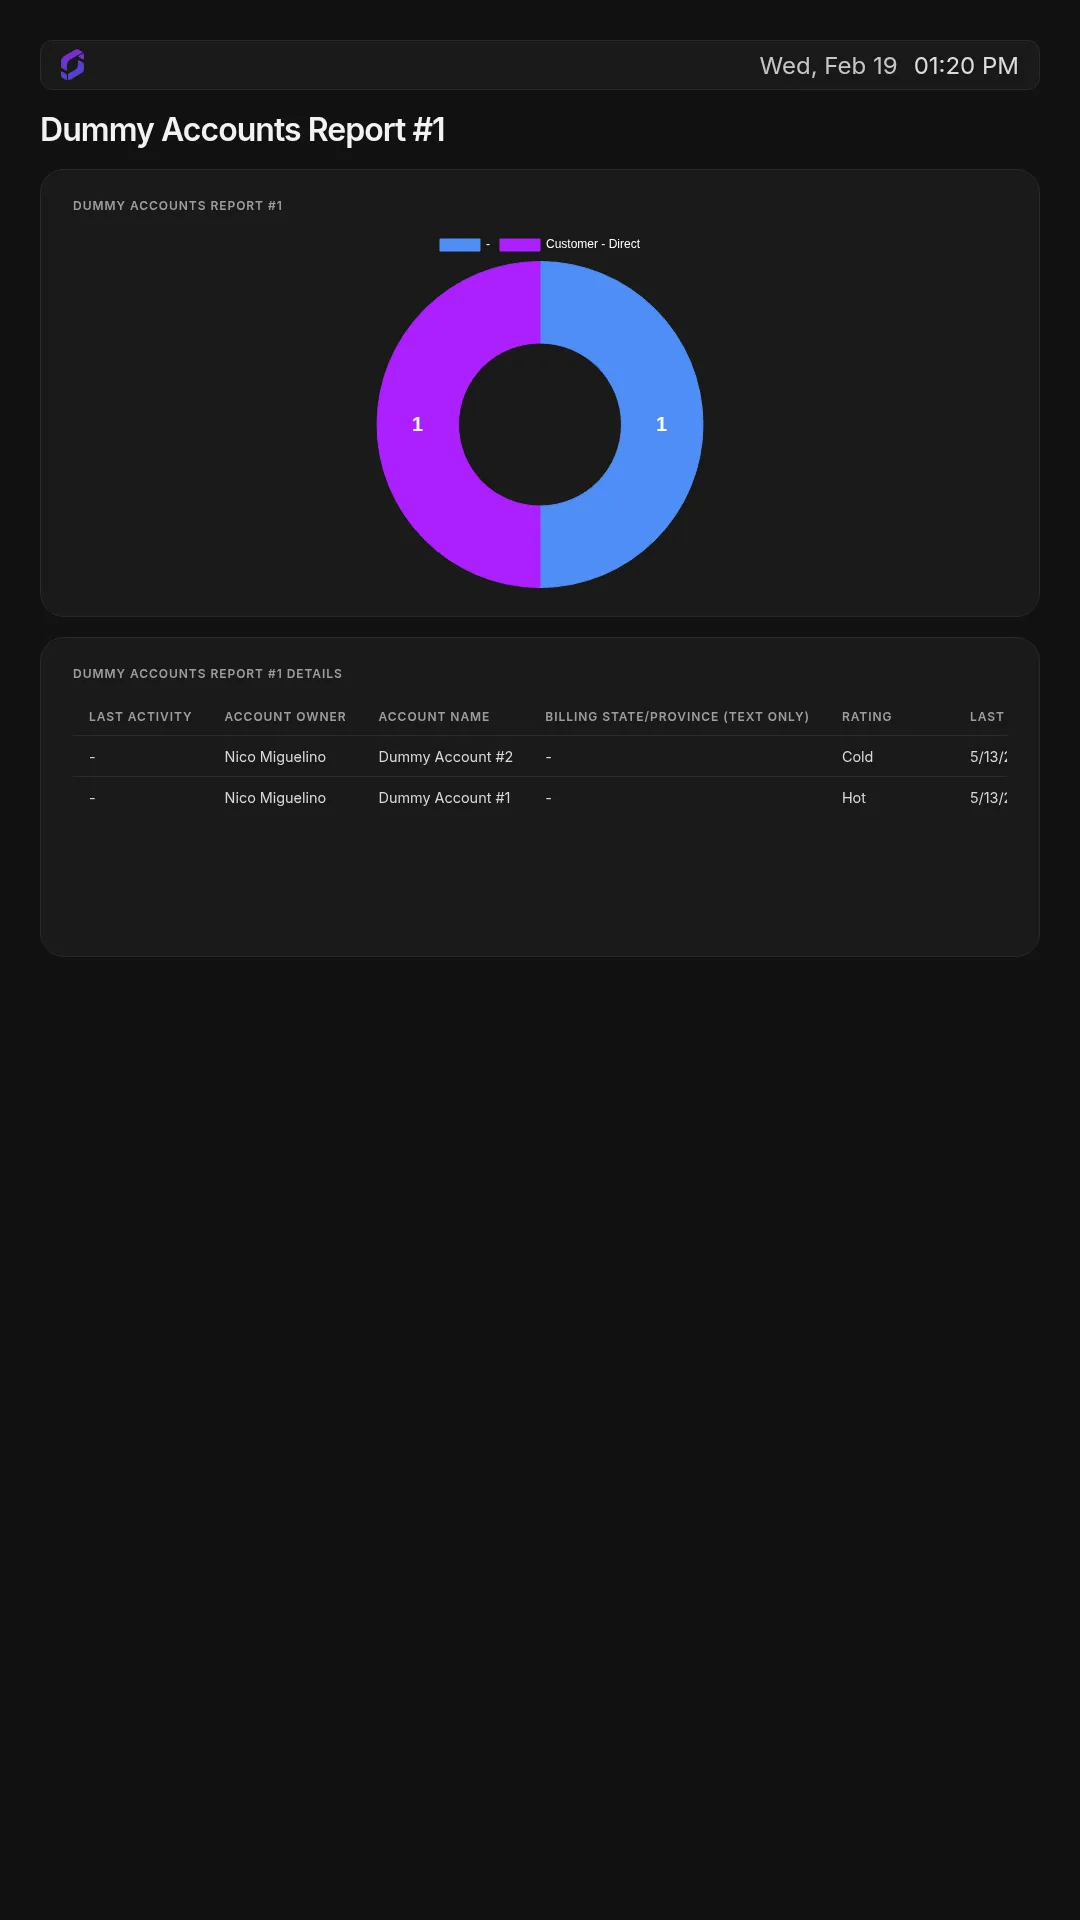
A responsive App for displaying Salesforce dashboards and reports on digital signage screens.
Salesforce Dashboard App
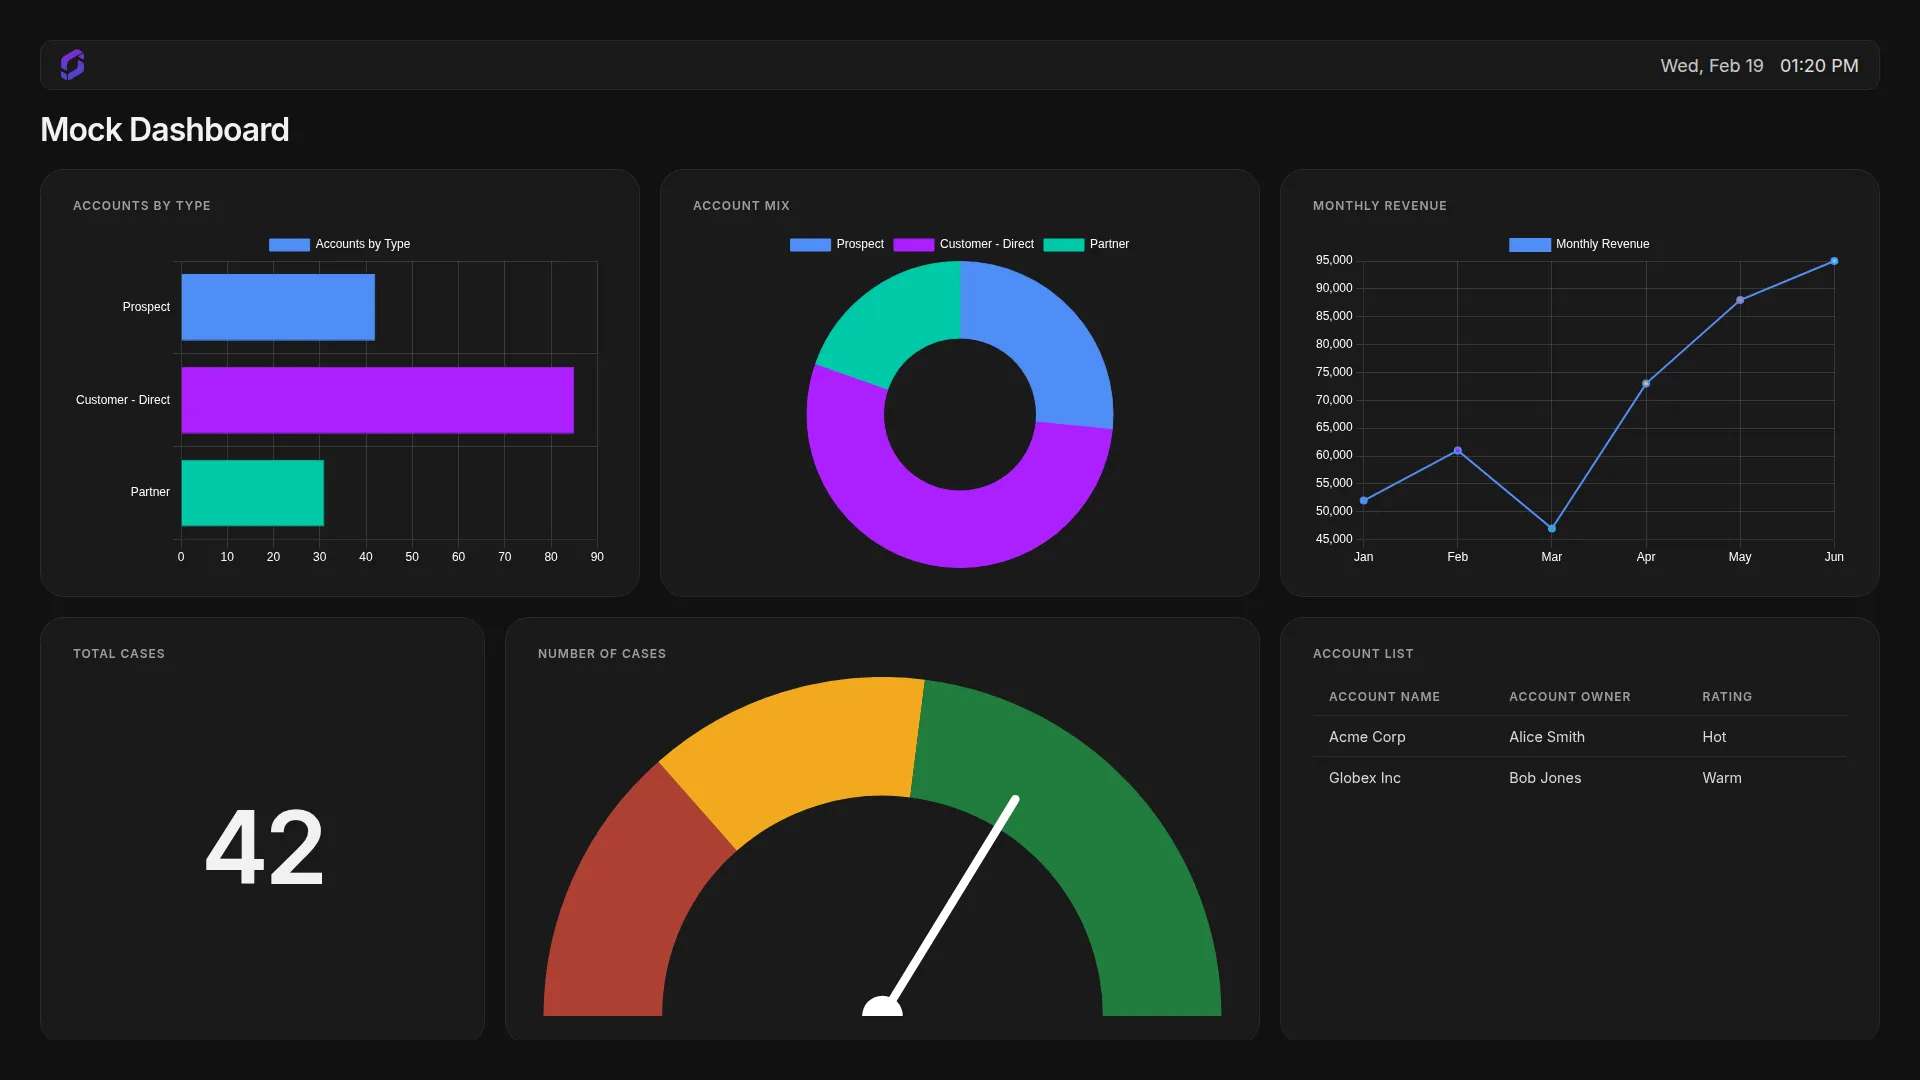
The Salesforce Dashboard App brings your live dashboards and reports directly to digital signage screens, keeping sales floors, offices, and operations teams up to date with real-time data. Secure OAuth-based authentication means no credentials are ever stored or hardcoded, while a configurable refresh interval ensures your displays always reflect the latest Salesforce data. Try the Salesforce Dashboard App today to turn your CRM insights into always-on displays that keep every team informed.
Display Salesforce Dashboards on Screenly
Step 1: Install the Screenly Package in Salesforce
Before connecting, your Salesforce org admin must install the Screenly Integration package. This is a one-time prerequisite.
- Share the following installation link with your Salesforce org admin: Screenly Salesforce Integration
- The admin opens the link and is taken to the Salesforce package installation page.
- Select who should have access to the integration:
- Install for Admins Only: recommended. Only the Screenly account owner needs to connect the integration, so admin-only access is sufficient.
- Install for All Users: grants access to all users in the org.
- Install for Specific Profiles: restricts access to selected profiles.

- Check the acknowledgment box and click Install (or Upgrade if a previous version is already installed).
NOTE: You can skip this step if the Screenly Integration package is already installed in your Salesforce org.
Step 2: Connect the Salesforce Integration
Log in to your Screenly account.
Go to Settings → Integrations.

Click Connect next to Salesforce.
A dialog will appear confirming the pre-requisite and showing the package installation link. If the package is already installed, click Connect to proceed. If you are connecting to a Salesforce Sandbox environment, enable the Sandbox toggle before clicking Connect.

You will be redirected to Salesforce to log in. Once authenticated, Screenly will be authorized automatically and you will be redirected back to the Integrations page, where Salesforce will now appear as connected
NOTE: Only the account owner can view and connect the Salesforce integration. Once the integration is added, other team members will be able to create and install the Salesforce Dashboard App on their own, and will be able to select any dashboard or report available in the connected Salesforce account.
Step 3: Install the Salesforce Dashboard App
Once the integration is connected, open the App Store.
- Search for the Salesforce Dashboard App, click Create.
- Enter a Name for this App. [1]
- Under Content ID, select the Resource type [2] — either Dashboard or Report.
- Select the specific Resource [3] from the dropdown list.
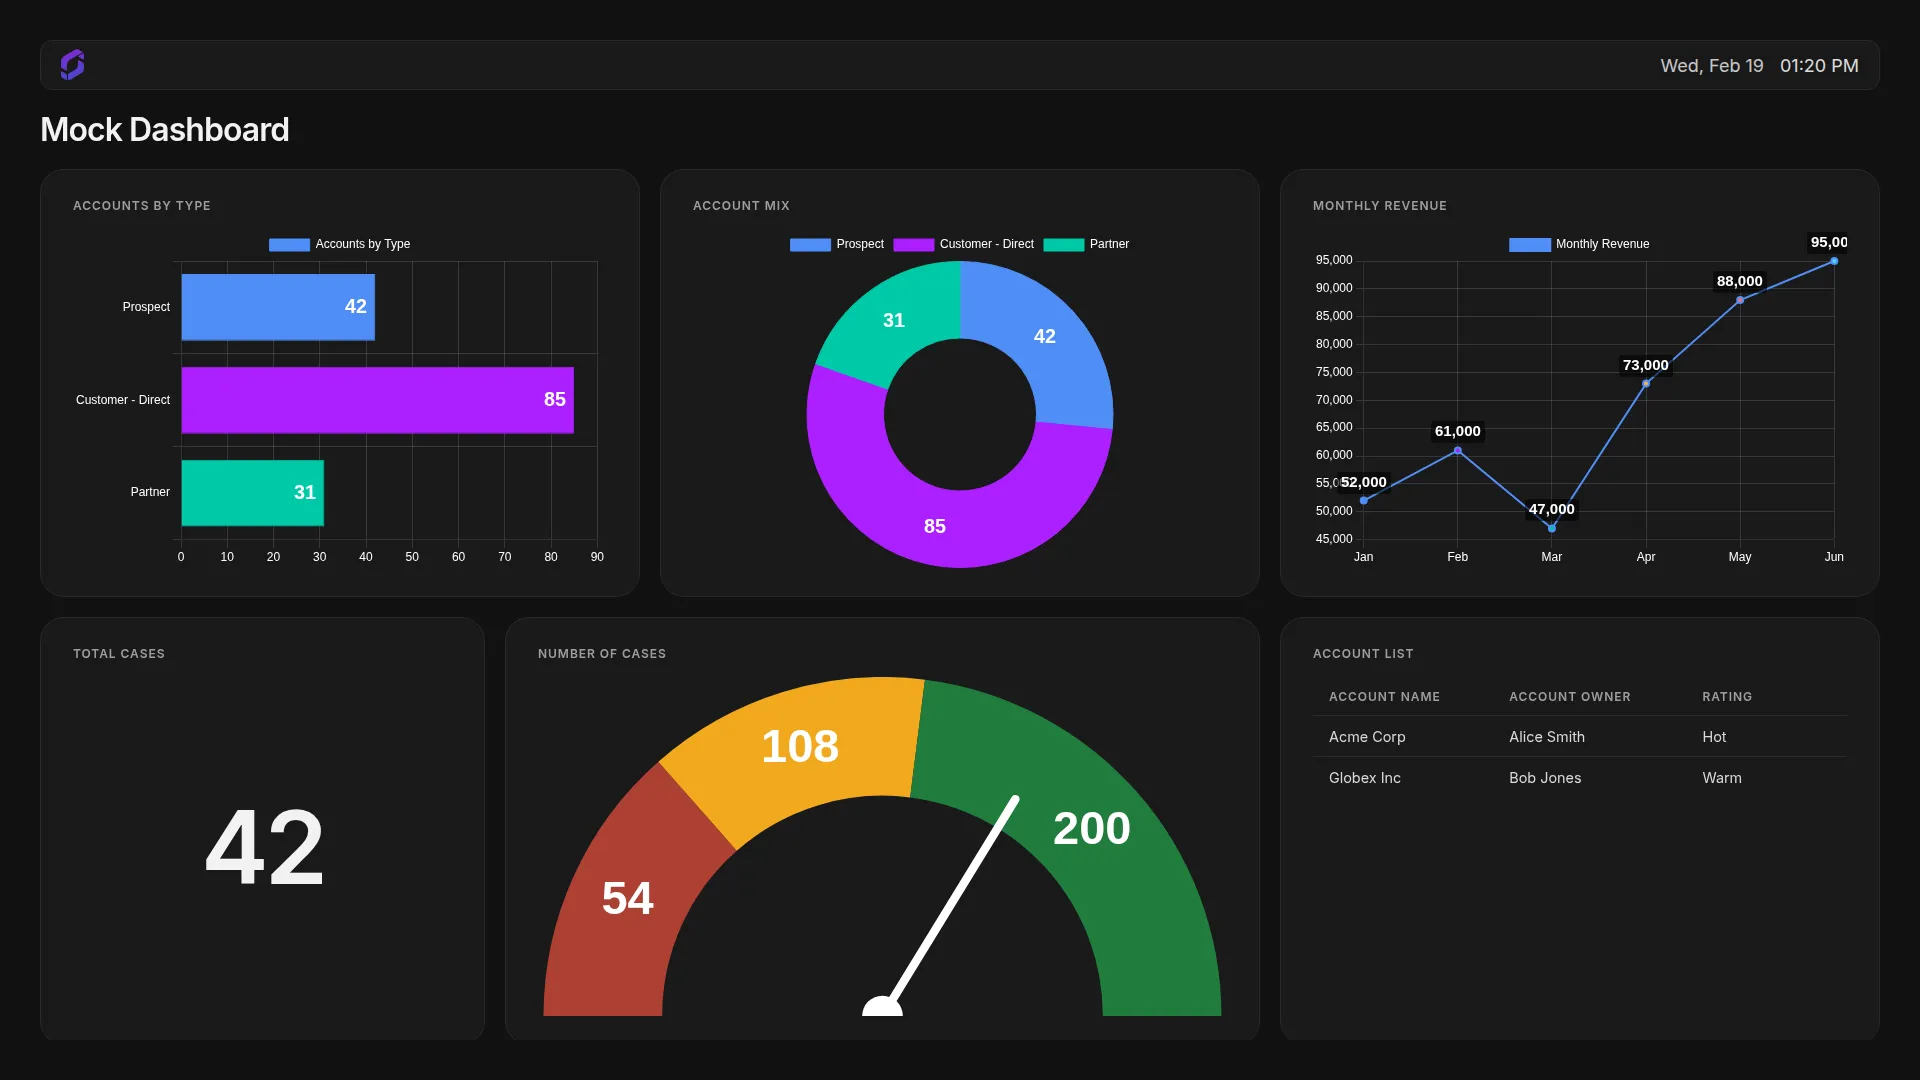
- Optionally, enable Show Labels to display data labels on charts and gauges.
- Click Install [4].

NOTE: Once the Salesforce integration is connected, your dashboards and reports are automatically retrieved. You can select them from the dropdown lists during app installation.
Supported Visualizations
For dashboards, the app renders components based on the visualization type configured in Salesforce:
| Visualization Type | Rendering | Notes |
|---|---|---|
| Bar | Horizontal bar chart | Grouped by report row groupings |
| Column | Vertical bar chart | Grouped by report row groupings |
| Line | Line chart | Grouped by report row groupings |
| Pie | Pie chart | Grouped by report row groupings |
| Donut | Doughnut chart | Grouped by report row groupings |
| Gauge | Gauge chart | Requires breakpoints configured in Salesforce |
| FlexTable | HTML table | Tabular reports with detail rows |
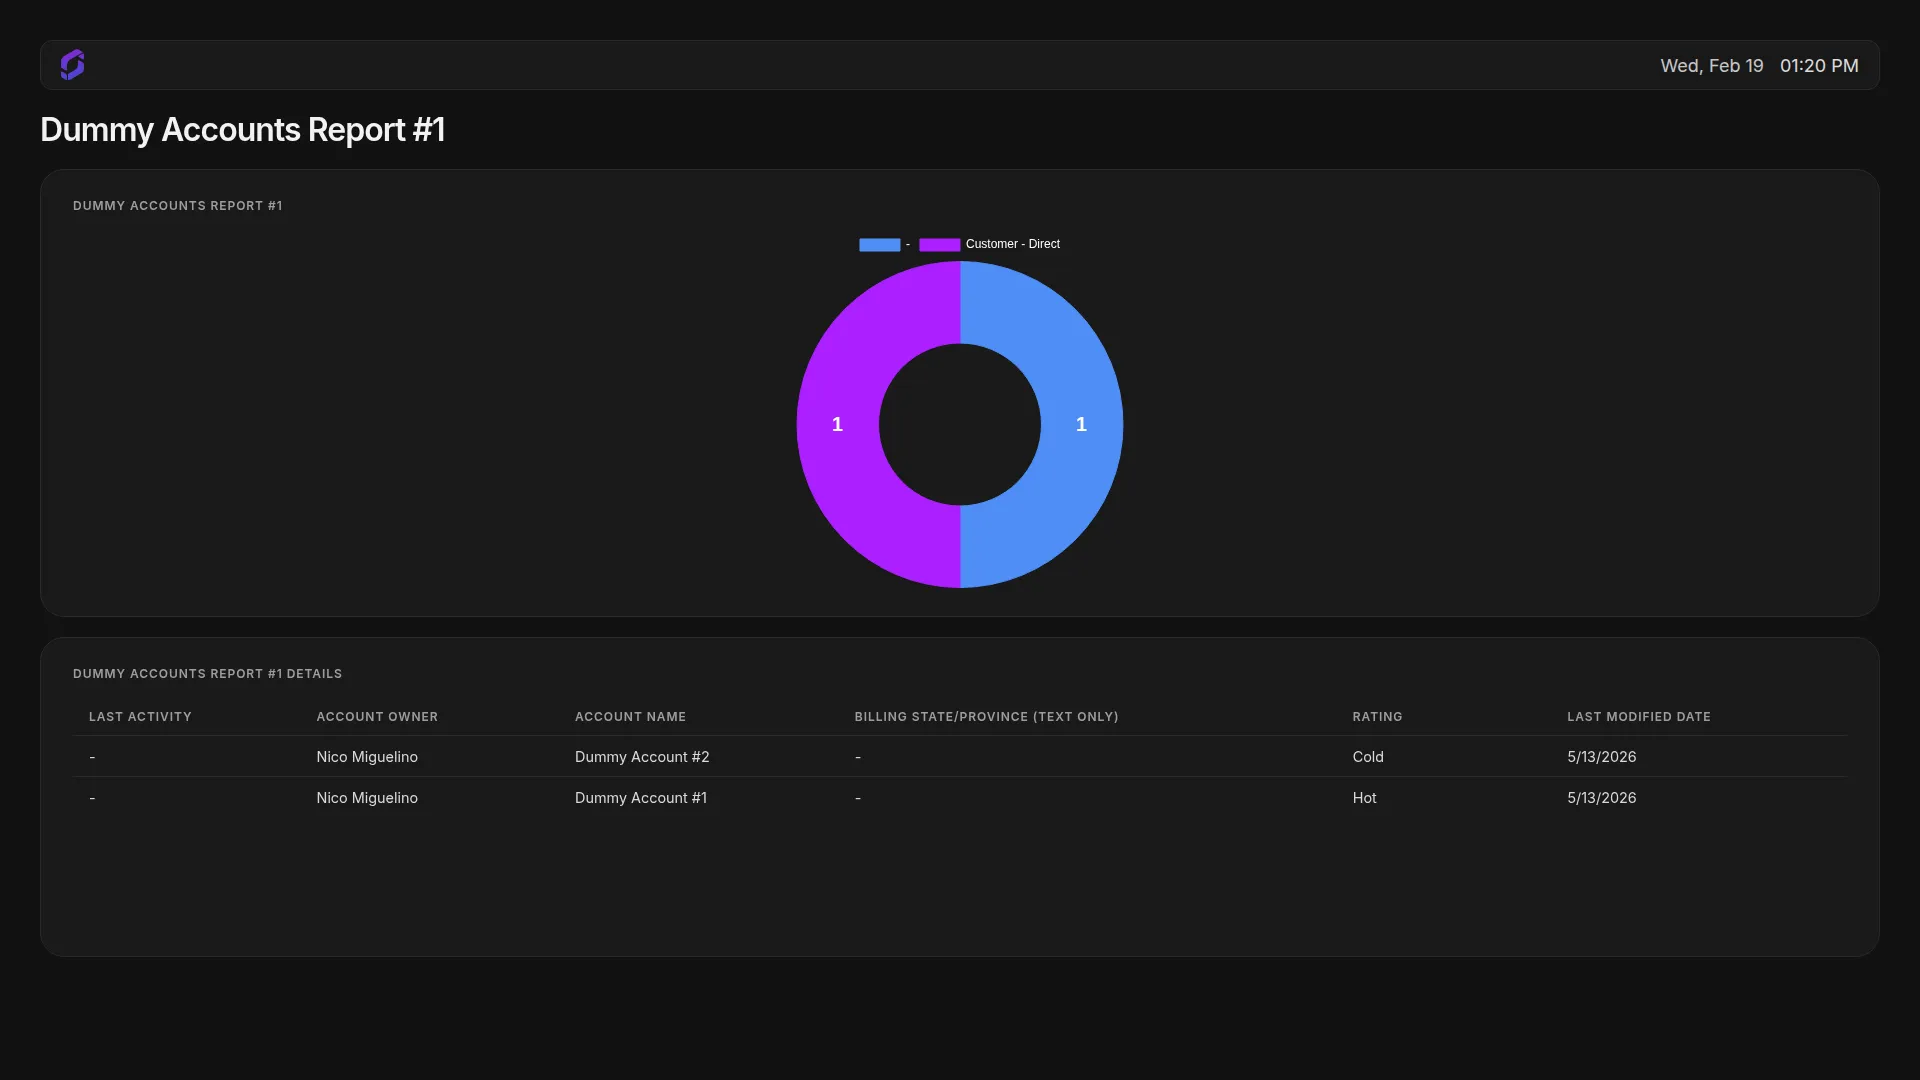
For direct report IDs, the app selects the best presentation automatically:
- Detail rows present: renders as a table.
- Grouped aggregate data present: renders as a chart.
- Single aggregate only: renders as a KPI-style value card.
Advanced Settings
The following optional settings are available when creating or editing an app instance:
| Setting | Description |
|---|---|
| Refresh Interval | How often (in seconds) to fetch updated data from Salesforce. Default: 300. |
| Show Labels | Show data labels on charts and gauges. Default: off. |
| Display Errors | Show errors on screen for debugging purposes. Default: off. |