
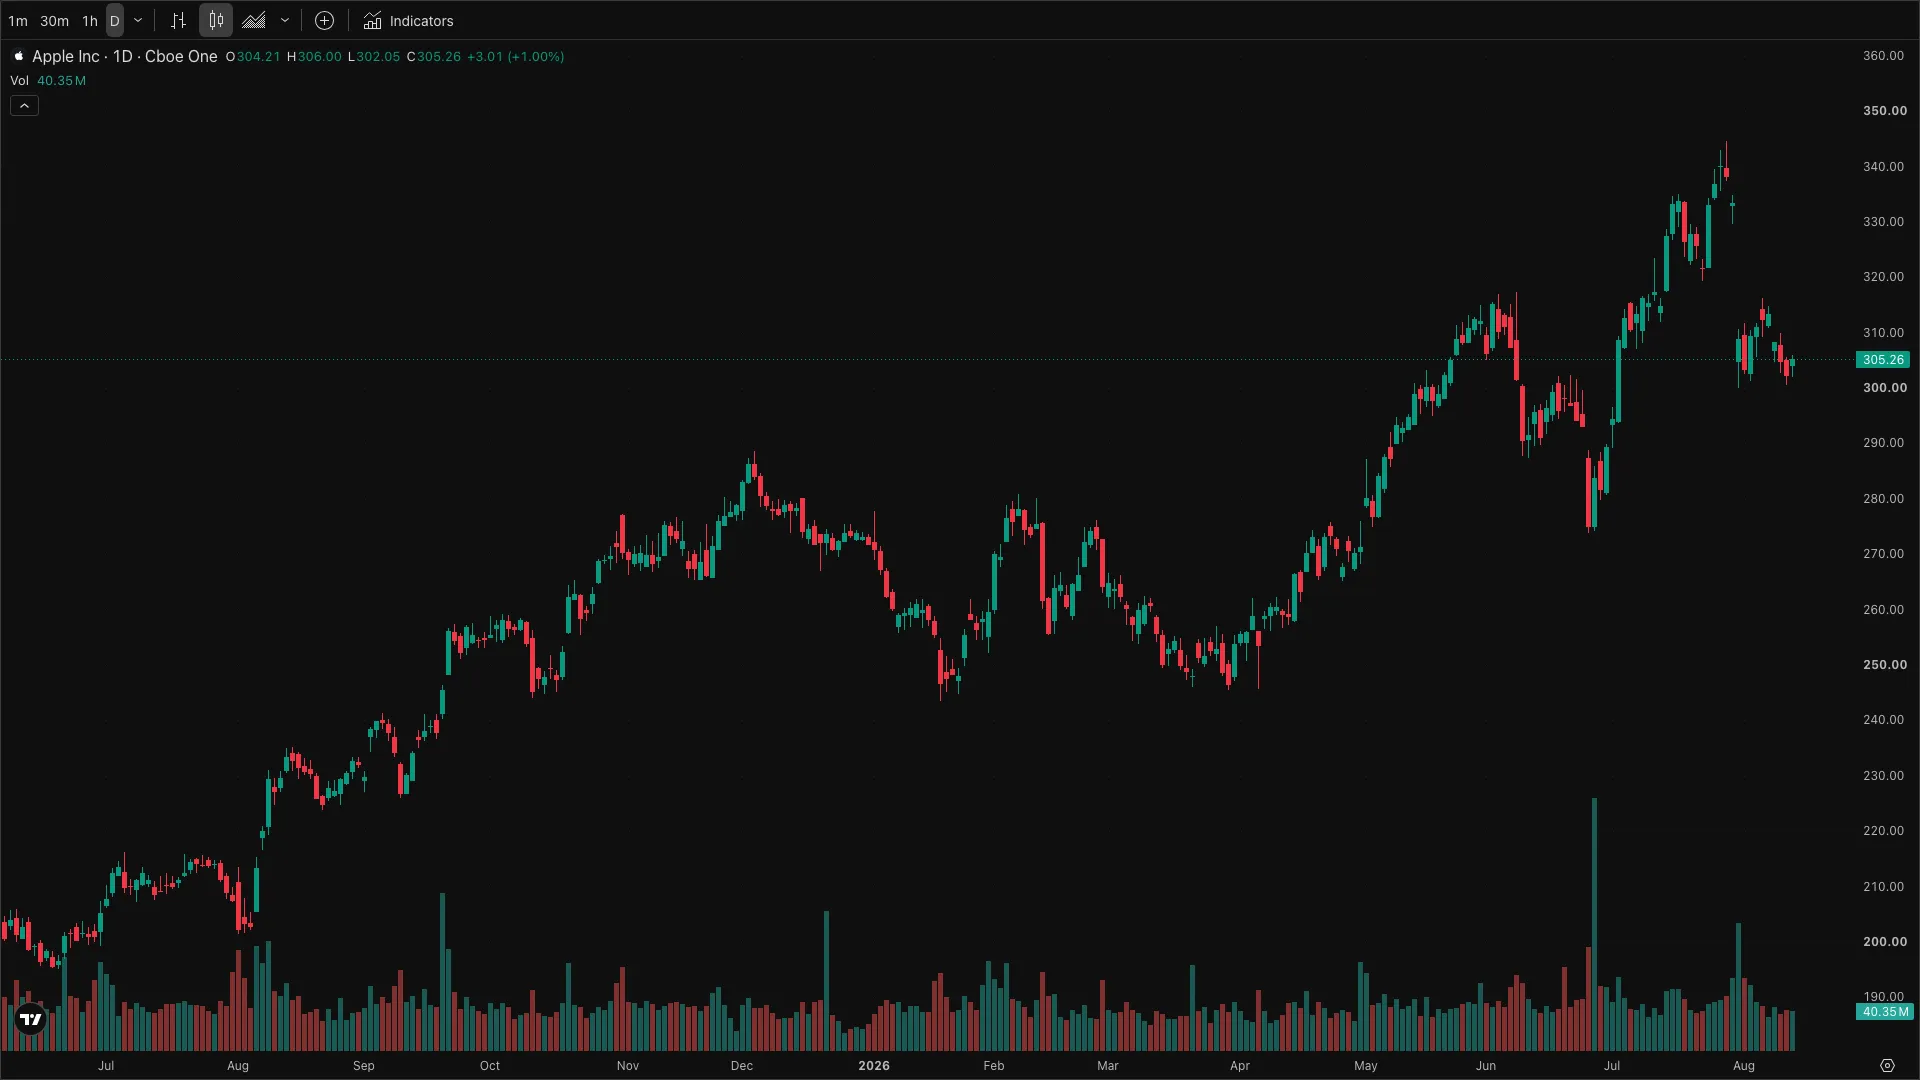
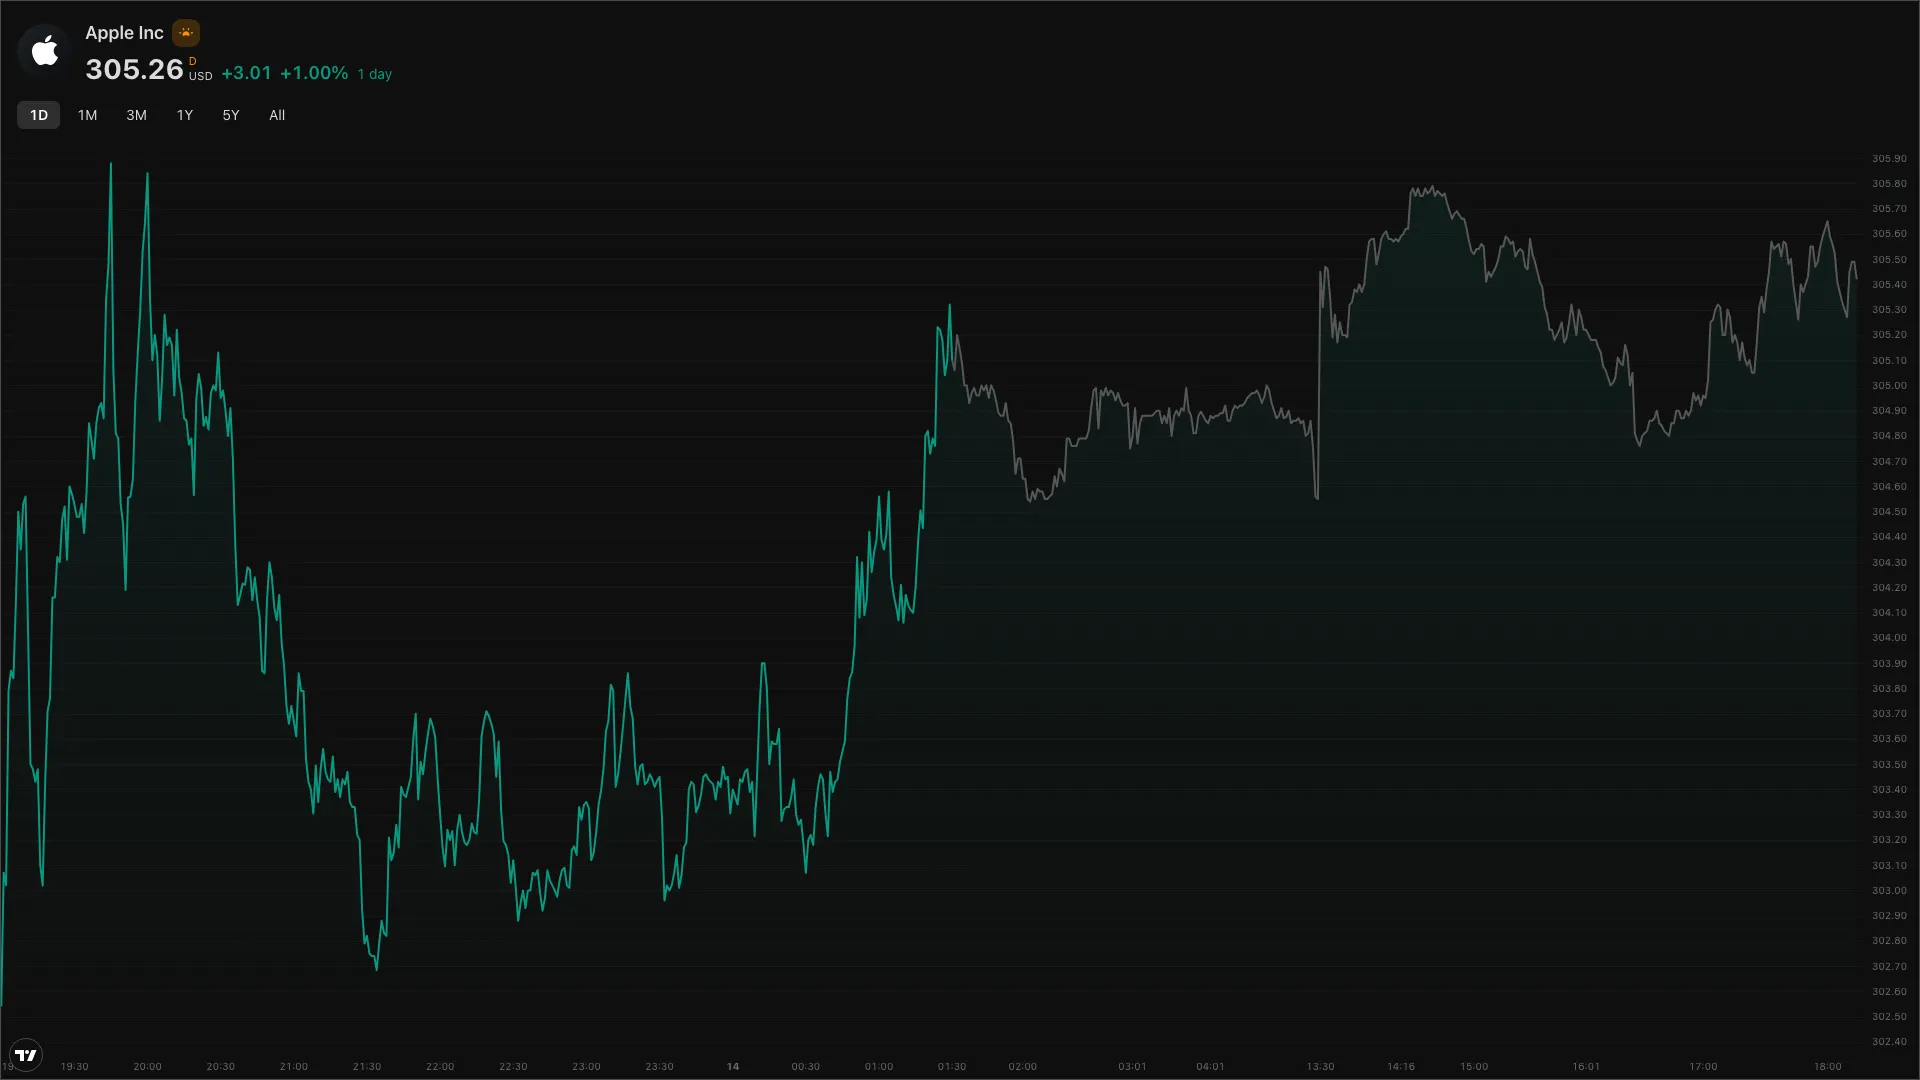
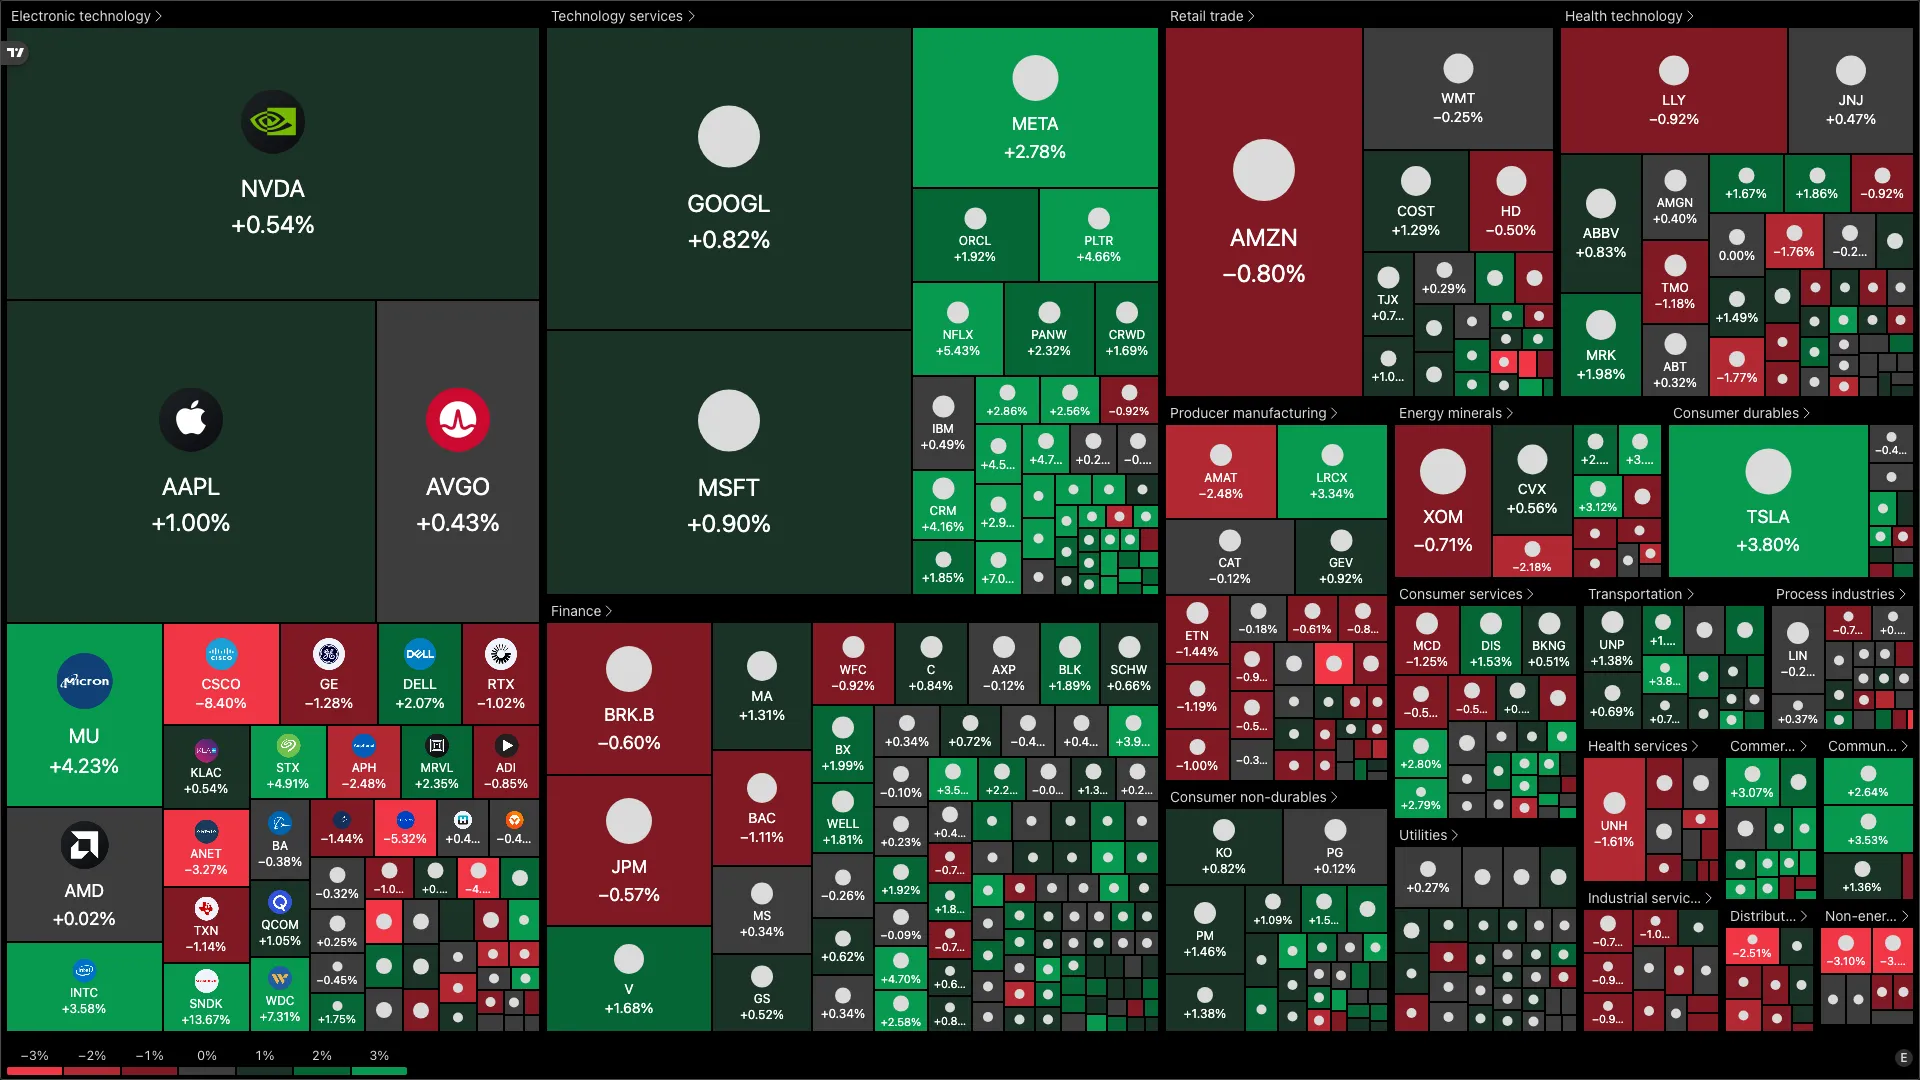
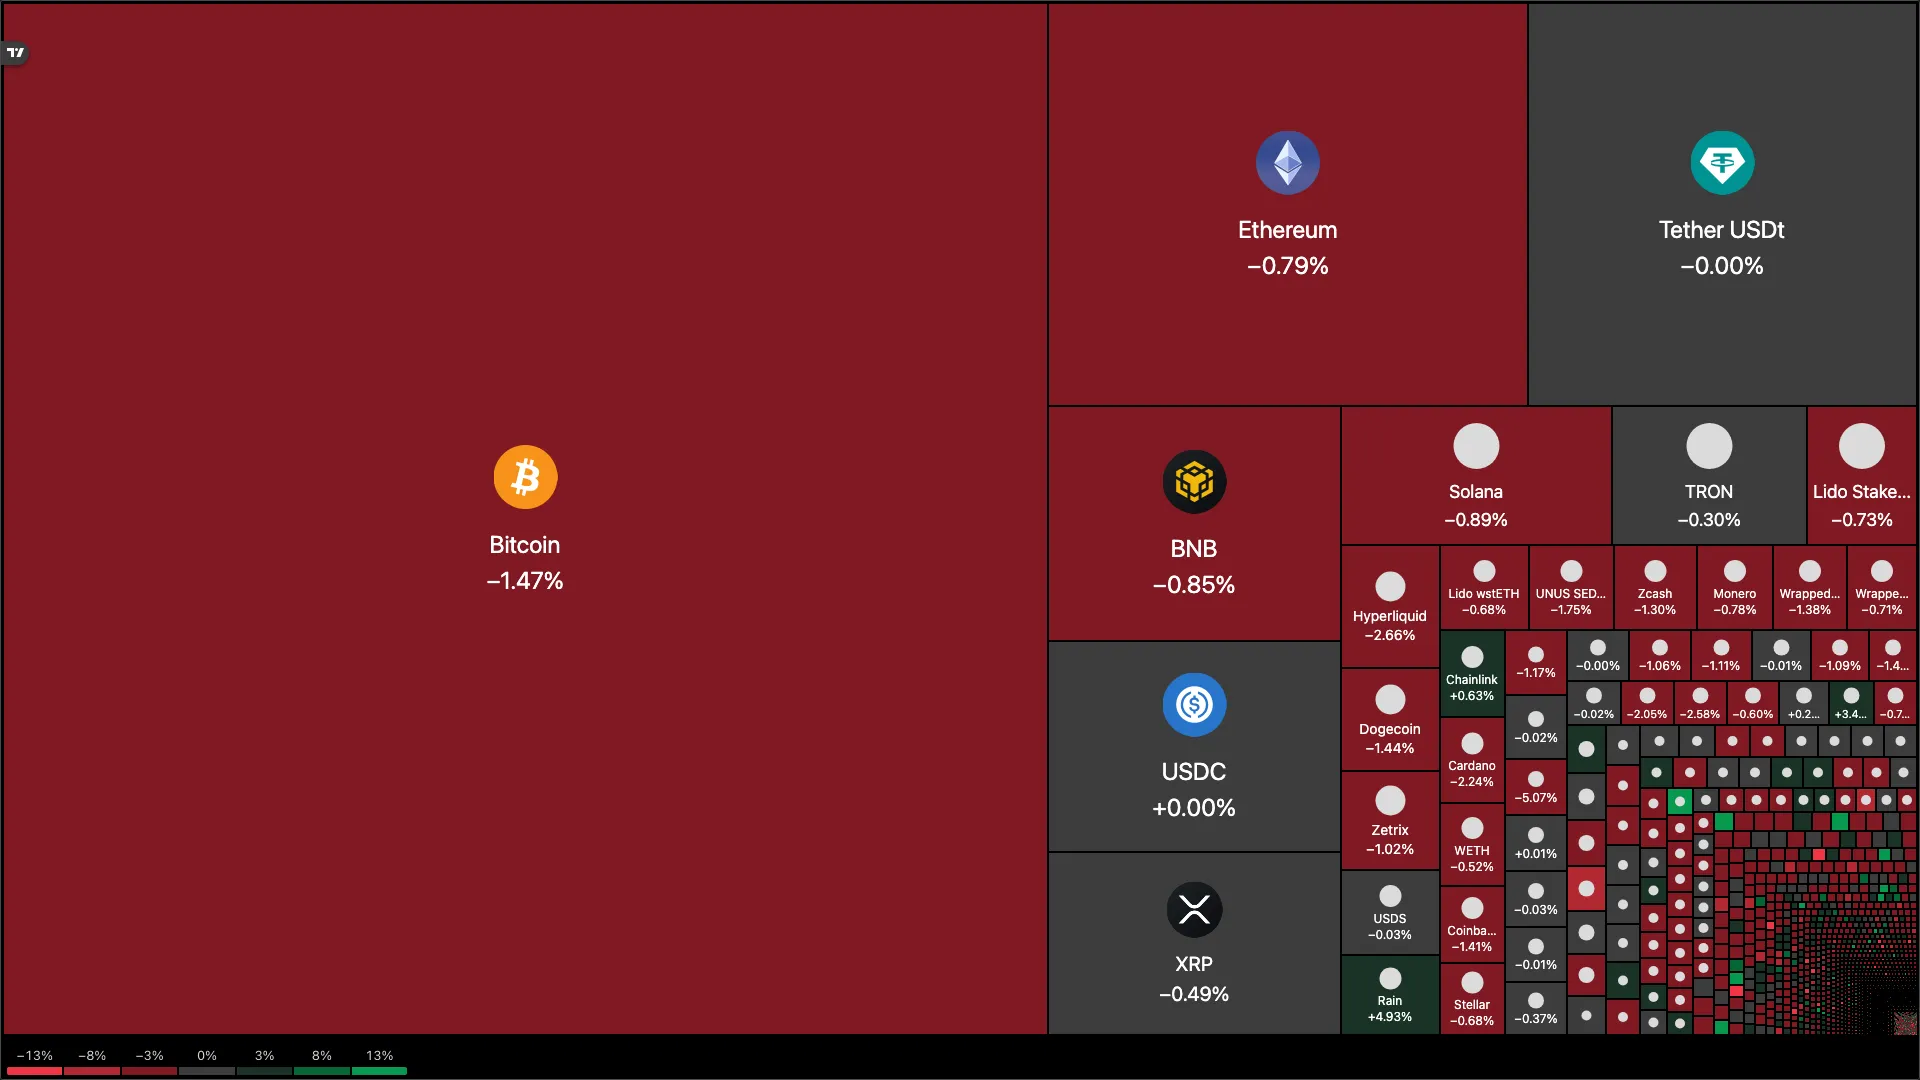
TradingView is a widely used platform for charts and market data across stocks, crypto, and other markets. With this Screenly app, you can display TradingView market widgets on your digital signs: charts, symbol overviews, and heatmaps, all full screen.
Display TradingView widgets on your digital sign
With Screenly, you can put TradingView’s market widgets on any screen. Pick a widget type, set the symbol or market, choose a theme, and deploy. The display updates live through TradingView’s embeds, with no custom charting code required.
Four widgets, one app
Choose which widget fills the screen:
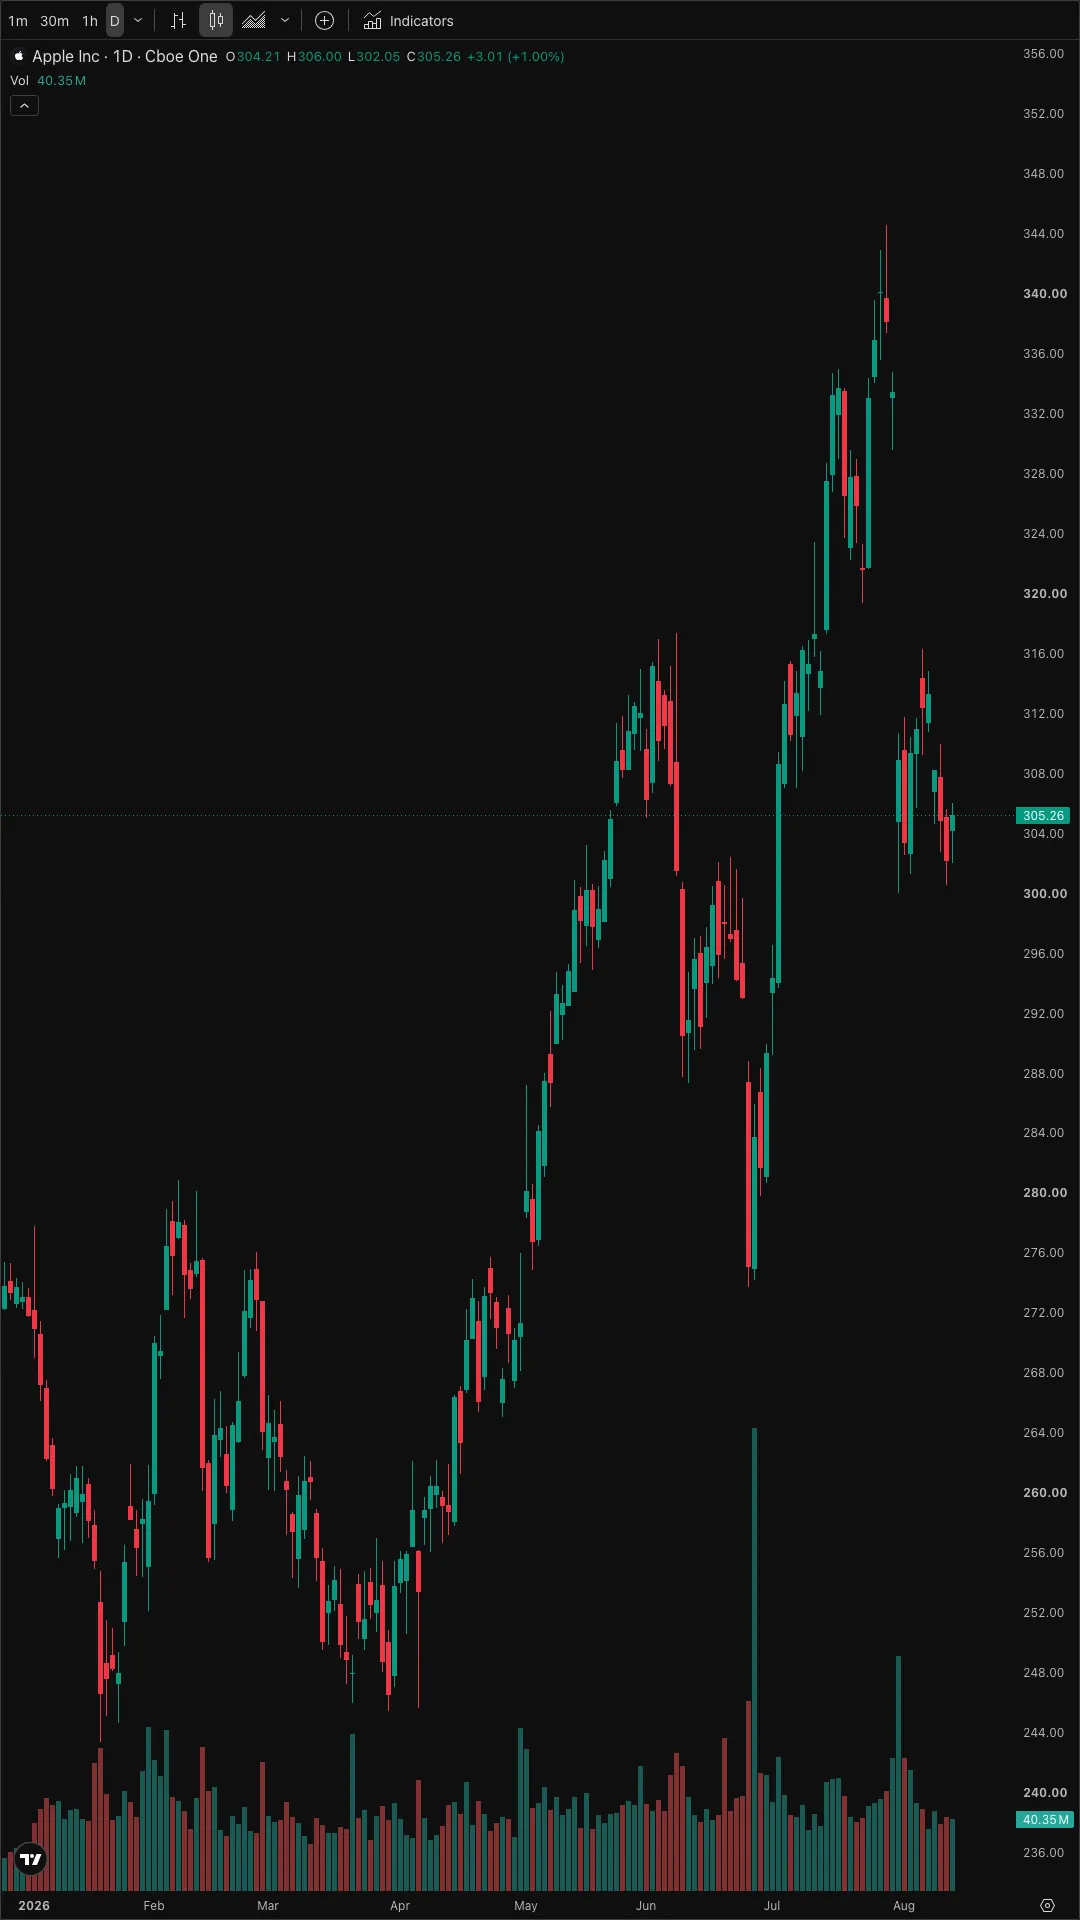
- Advanced Real-Time Chart: full TradingView chart with interval, style, and toolbar options
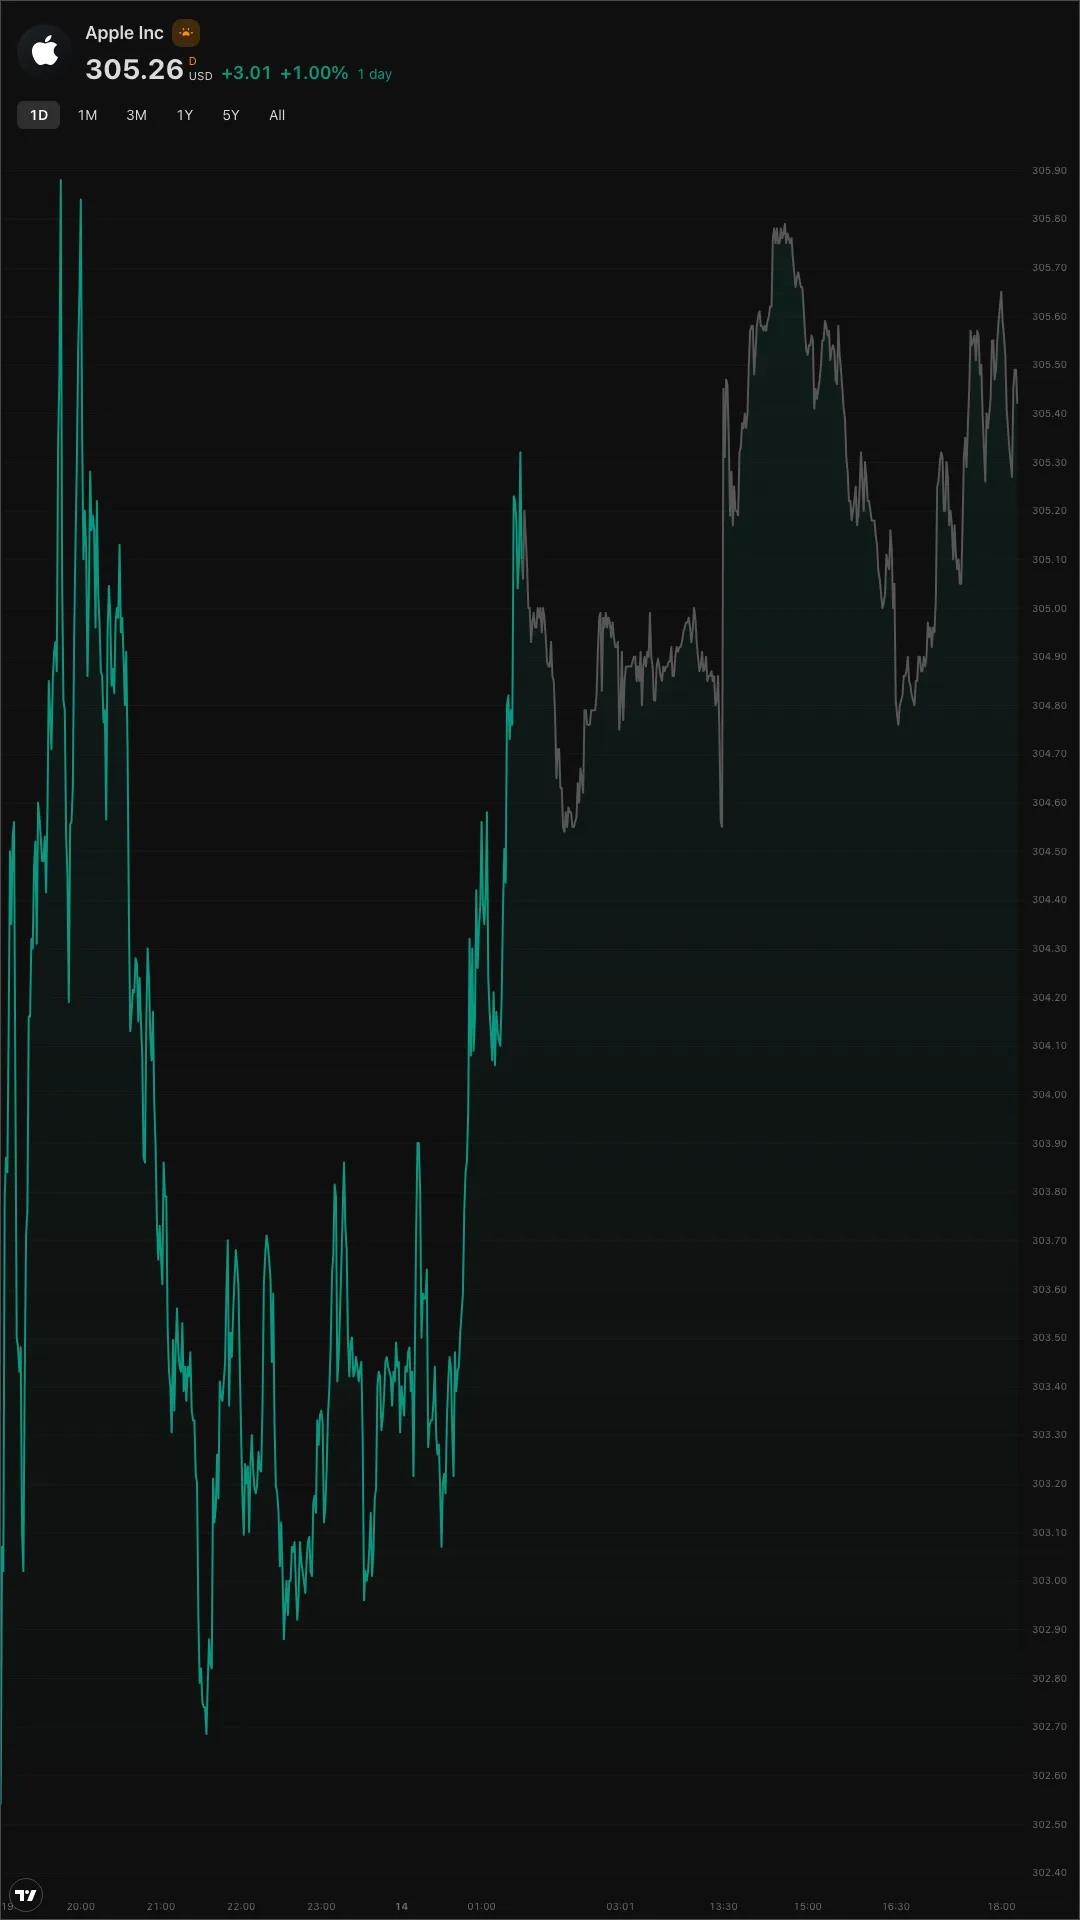
- Symbol Overview: single-symbol area chart and price, sized for signage
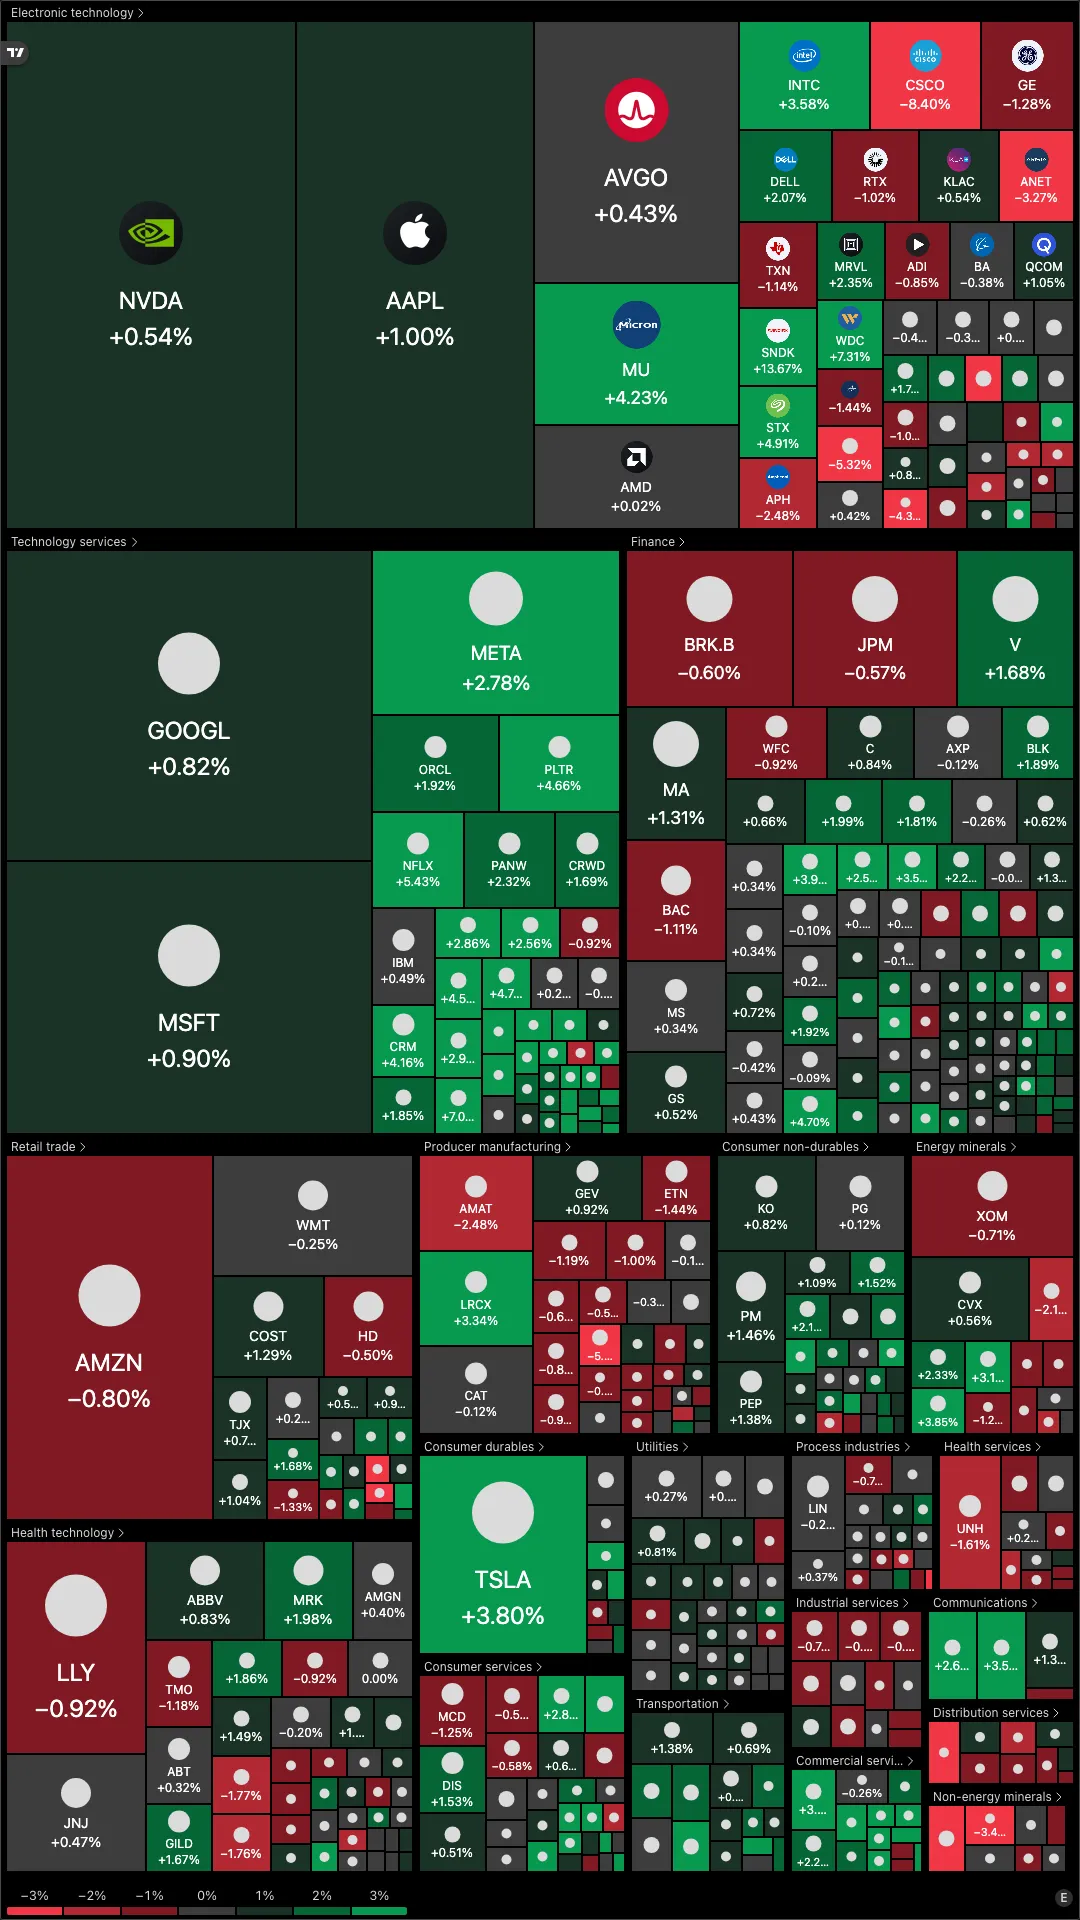
- Stock Heatmap: sector or flat view of a market (S&P 500, Nasdaq 100, and more)
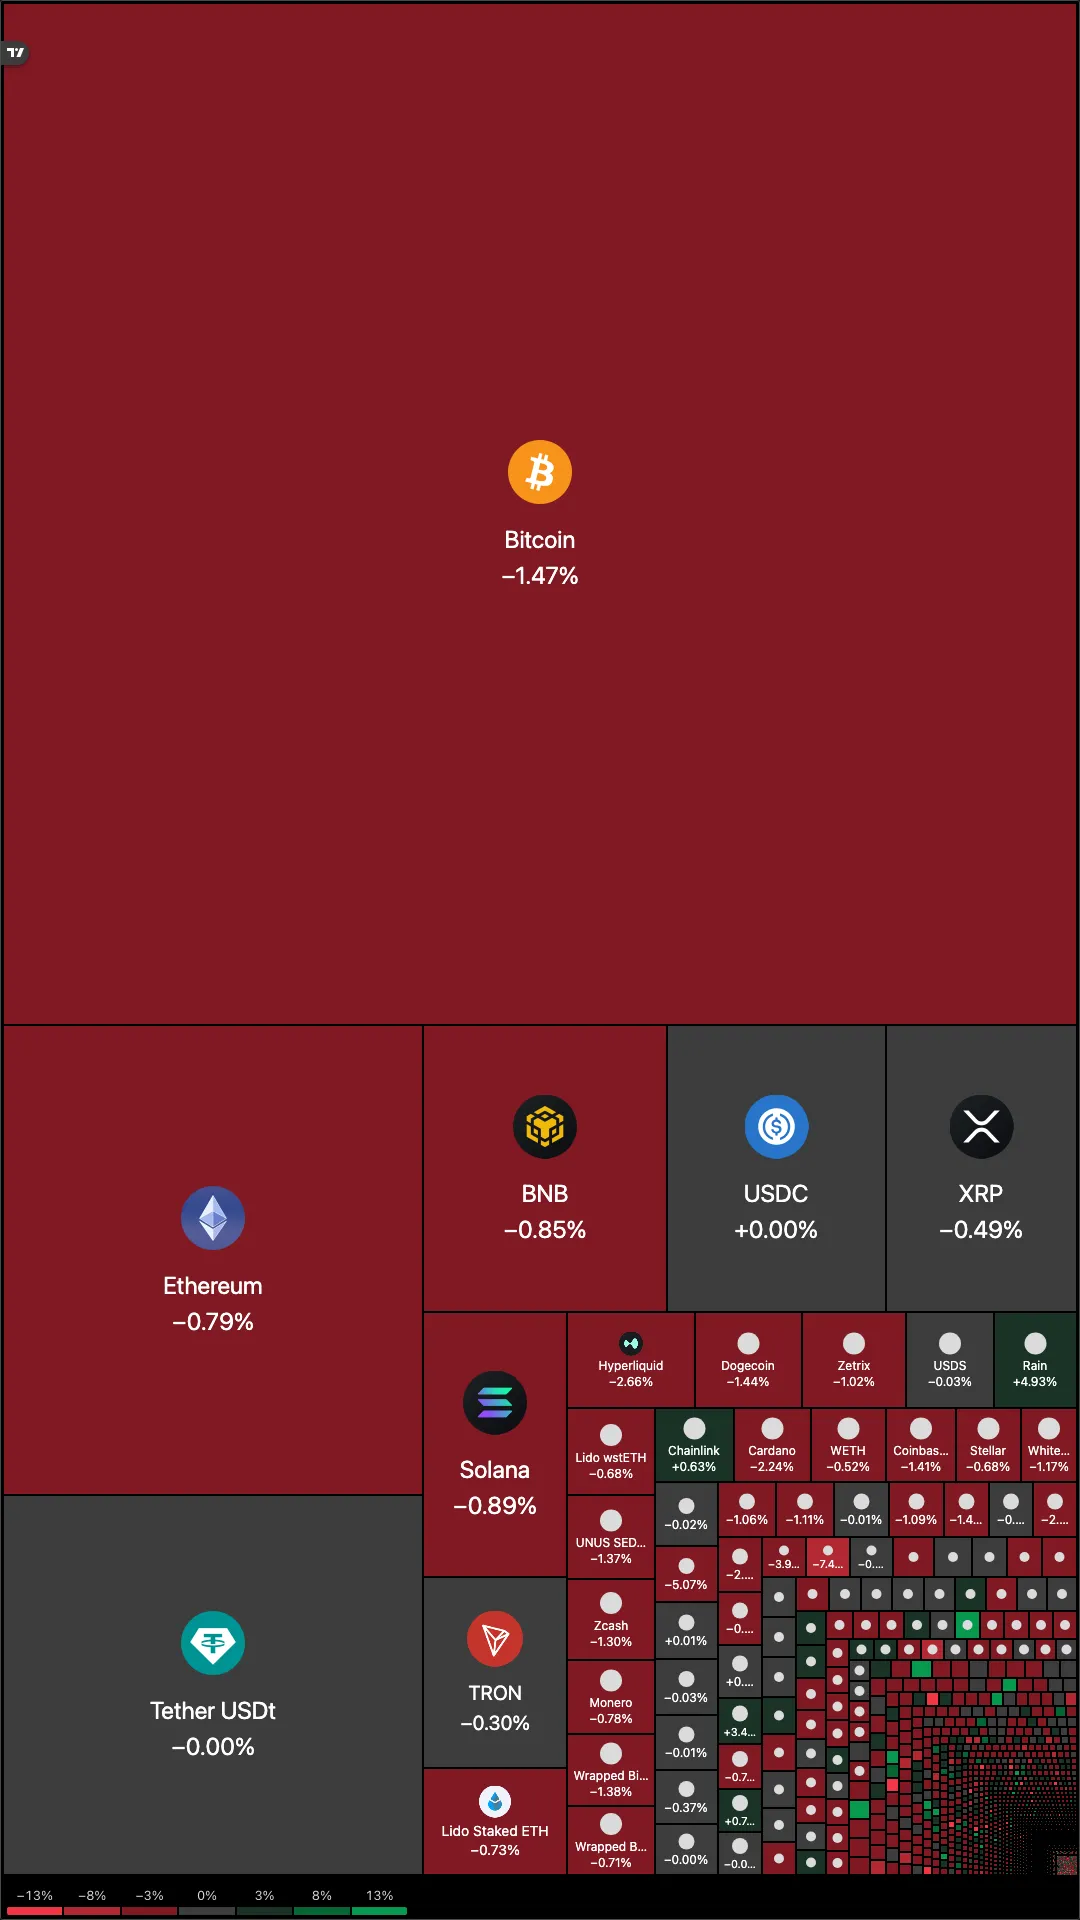
- Crypto Heatmap: full crypto market at a glance
Display TradingView Widgets on Screenly
Step 1: Install the TradingView Widgets App
- Log in to your Screenly account.
- Open the App Store and search for TradingView Widgets.
- Click Create.
- Enter a Name for this App.
- Click Install.
Step 2: Configure the widget
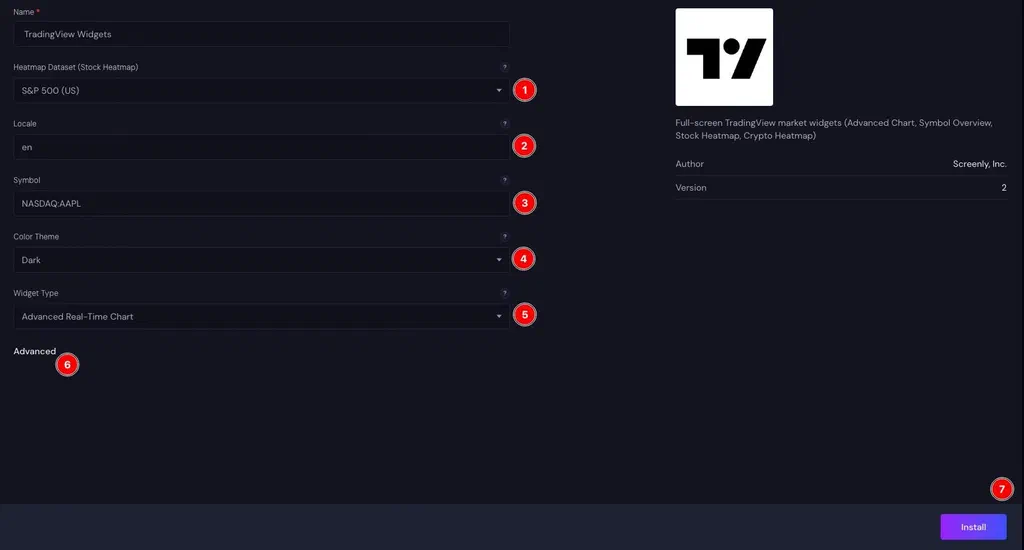
- For Stock Heatmap, set Heatmap Dataset if you want a specific market (for example S&P 500).
- Set Locale to the language code for the widget UI (for example
en,fr, orde). - Set Symbol to the ticker you want to show, in
EXCHANGE:SYMBOLformat (for exampleNASDAQ:AAPL). This applies to Advanced Chart and Symbol Overview. - Set Color Theme to Dark or Light to match how you want the widget to look on screen.
- Choose a Widget Type (Advanced Real-Time Chart, Symbol Overview, Stock Heatmap, or Crypto Heatmap).
- Optionally open Advanced to fine-tune chart and heatmap behavior (see below).
- Click Install (or Save if you are editing an existing app).
Advanced Settings
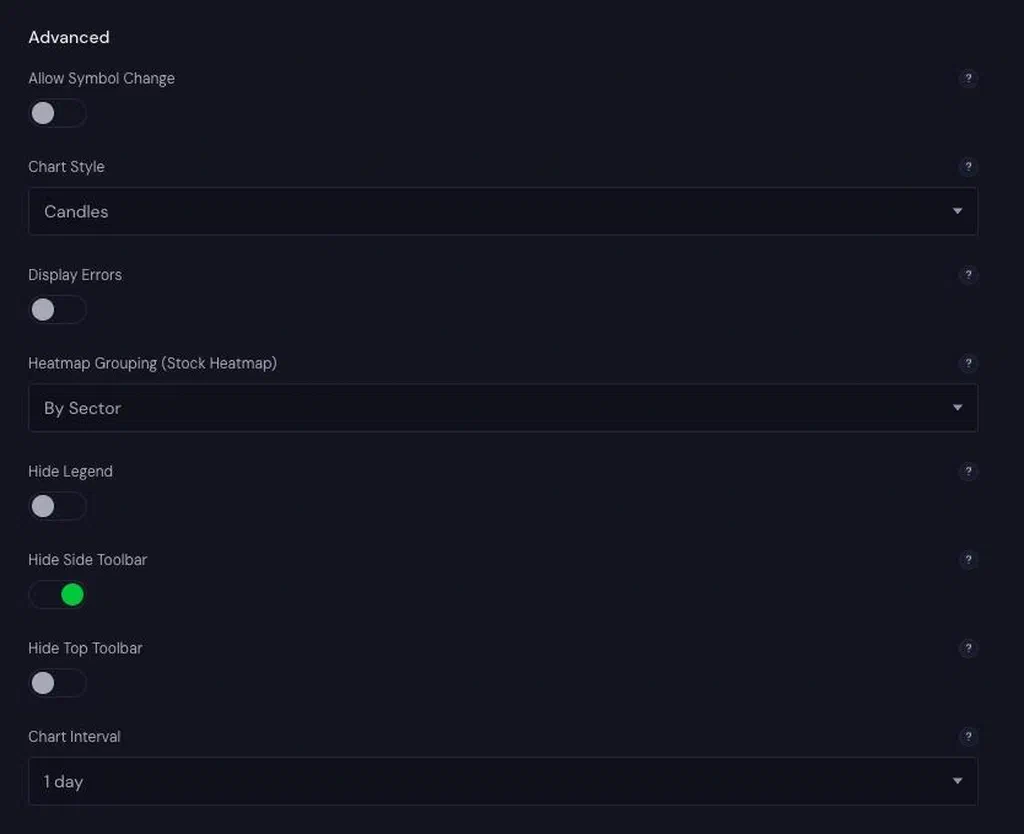
The following optional settings are available under Advanced when creating or editing an app instance:
| Setting | Description |
|---|---|
| Allow Symbol Change | Let viewers change the symbol on the Advanced Chart. Usually left off for unattended signage. |
| Chart Style | Candle, bar, line, or area style for the Advanced Chart. |
| Display Errors | Show errors on screen for debugging. Default: off. |
| Heatmap Grouping (Stock Heatmap) | Group the Stock Heatmap by sector, or show a flat grid. |
| Hide Legend | Hide the Advanced Chart symbol legend overlay. |
| Hide Side Toolbar | Hide the Advanced Chart drawing toolbar. On by default for signage. |
| Hide Top Toolbar | Hide the Advanced Chart top toolbar (interval and style controls). |
| Chart Interval | Default time interval for the Advanced Chart (for example 1 day). |
Step 3: Add the app to a screen
- Add the app to a playlist.
- Assign that playlist to a screen.
In minutes, you’ll have live market data showing on your display.