
(This is a post includes a fair amount of technical details. If you don’t care about the technical details, then the tl;dr is that we made infrastructure changes that had unexpected side effects, which caused stability issues.)
As some users may have noticed, we had stability issues last week. The purpose of this post is to share some technical details on this issue and provide you with what we are doing to ensure this won’t happen in the future.
The background
Until last week, Screenly’s backend was hosted on a number of servers on Google Compute Engine (GCE). This has served us well, and we have had a very good track record in terms of uptime. We were however aware of the the setup we were using had a few Single-Point-of-Failures (SPoF), meaning if one server/service could potentially take down the entire infrastructure. This by itself is pretty common across small to medium sized companies. However, as we have seen a rapid growth in Screenly, we wanted to resolve this, while also future proofing our infrastructure such that we could scale horizontally (meaning that we want to be able to add and remove servers easily based on demand).
After much research, we decided on Kubernetes and started porting our application stack. This by itself was fairly straight forward, as have already been using Docker for the last few years. We eventually moved our staging environment to Kubernetes and did a lot of testing to make sure everything worked as expected. After confirming that everything worked fine, we scheduled a go-live date, which was on Tuesday of last week.
The outages
After taking the platform live, we first noticed some strange connection issues from various locations across the globe (we use both Pingdom and StatusCake for monitoring the uptime and performance). We initially attributed this to regular routing issues. This is something that you see from time to time, when there are interruptions or issues somewhere between point A and B on the internet. More interestingly, everything worked just fine for the vast majority of our users. However, every Nth visitor, would just get a timeout[1]. We literally spent days trying to figure out where these timeouts came from and even consulted with Kubernetes experts to pin point the issue. We eventually found that it was a configuration in Google’s Cloud Load Balancer that differed a little bit between the staging and production setup[2]. Once we changed this setting, the timeouts went away.
This leads us to the big outage that we had that lasted for a few hours on the night between Wednesday and Thursday (UTC). What happened then was that we had a big spike in traffic. That by itself isn’t rare, but what we hadn’t accounted for was the behavior of the memory consumption of one of our back-end components. Normally, the cluster would have auto recovered from this if it wasn’t for that we overloaded the memory consumption had a domino effect, which knocked out some key components.
To make matters worse, we discovered the next day that the monitoring system that should have alerted an engineer about the outage didn’t indeed work as expected, which is why the outage lasted for a few hours rather than being remedied quickly.
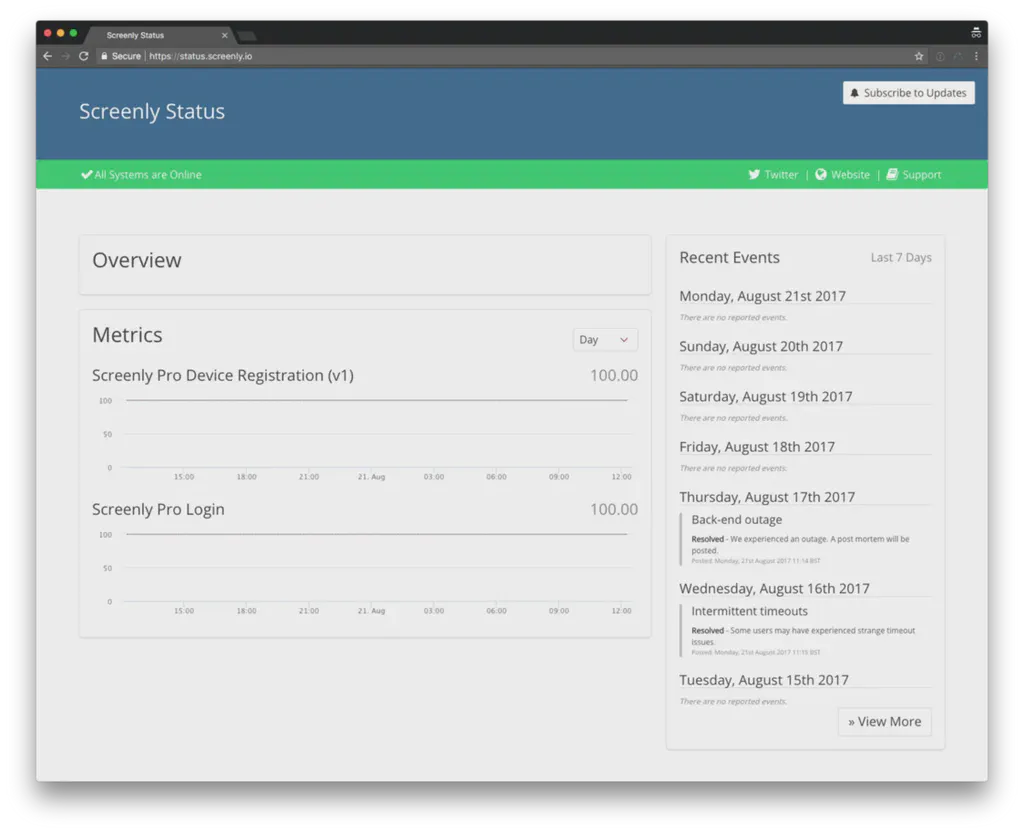
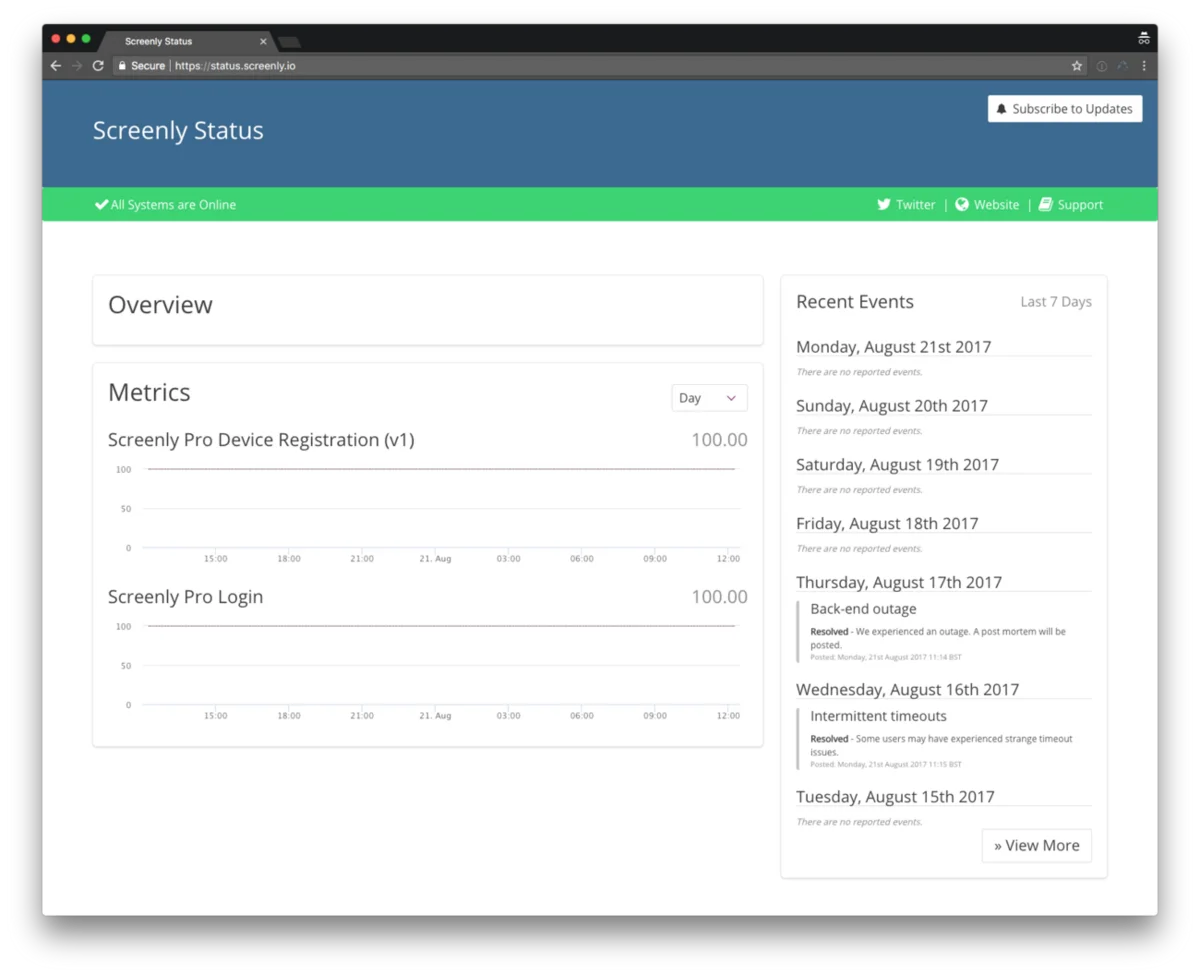
Our new public status page that’s available at status.screenly.io
Lessons learned
There are a number of lessons to learn from this outage, and we are working now on implementing these measures to ensure this will not happen again. Here are some of the measures that we will take:
- When making large changes, we need to do try to do more realistic testing to better simulate real workloads. This is a rather tricky thing to do, but if we would have done better load testing, we would likely have caught this issue earlier.
- We have setup a public status page (status.screenly.io), which shows the status of our systems in real time based on a 3rd party monitoring status of our systems. This also includes information about outages.
- We have already started to collect more application metrics (using Prometheus) such that we both spot trends better and more quickly find bottlenecks.
- Configure better health checks and resource limitations on our back-end components such that even if a spike hits, the system will automatically cope with this.
- Set up automatic scaling of the cluster, such that the system can automatically add more resources whenever needed.
- Ensure that our alerting system works such that an engineer alerted (or even woken up) if there is an issue.
The good news however is that even if our back-end was inaccessible for a few hours, it did not impact the players at all. We designed Screenly from day one to be able to survive outages, so while users were unable to make changes to the content, there was no impact on the actual playback.
— — — — — ** **[1] We don’t know exactly what N was, as they never hit our load balancers. All we could see was that we had a good amount of traffic flowing through our load balancers even during this time period. [2] The configuration difference was a missing health check in a TCP load balancer, which was the reason why a percentage of the traffic was incorrectly routed and caused a timeout.