Every second a production line sits idle costs money. In automotive assembly, that number can run into the thousands of dollars per minute. Yet in many plants, the system responsible for flagging a stoppage is still a colored light on a pole, visible only to whoever happens to be looking in the right direction at the right moment.
The andon system was never meant to stay that simple. When Toyota formalized it as part of the Toyota Production System (TPS), the idea was radical: give every operator the authority to stop the line and summon help the instant something goes wrong. The light was just the signaling mechanism available at the time. What mattered was the response, not the lamp. Digital signage is now catching up to that original intent, replacing stack lights with networked screens that carry context, routing, and timestamps.
A quick history of andon on the factory floor
The word andon is borrowed from Japanese, where it originally referred to a paper lantern. Its manufacturing usage traces back to Sakichi Toyoda’s automatic loom of 1896, which could detect a broken weft thread and stop itself before producing defective cloth. That idea, machines that stop and call for help rather than running blind, became the foundation of jidoka, one of the two pillars of the Toyota Production System alongside just-in-time flow.
By the time Taiichi Ohno built the TPS into a full operating philosophy, jidoka had expanded beyond machines. Human operators on the assembly line were given pull cords and call buttons. Pull the cord once, and a team leader gets a signal to come help. If the issue can’t be resolved before the work piece reaches the end of the station, the line stops. A colored light on an andon board overhead tells everyone which station called and what triggered it.
The system was revolutionary. It gave frontline workers genuine authority over production quality. At NUMMI, the GM-Toyota joint venture in Fremont, California, operators pulled the andon cord thousands of times per shift. Management knew each pull cost roughly $15,000 per minute of lost output, yet they considered it a bargain compared to shipping defects to customers. That cultural commitment hasn’t changed. But the signaling technology in most plants has barely evolved since the 1980s.
Why traditional andon lights fall short
A stack light does one thing well: it tells you something is wrong somewhere. A red lamp means a stoppage, yellow means a call for help, green means running normally. In a compact work cell where a team leader is always within earshot, that can be enough.
But modern production environments have outgrown those constraints in several important ways.
Visibility is limited to line-of-sight. A stack light on Line 4 is invisible to the maintenance technician working three aisles over, the quality engineer in the lab, or the production manager reviewing schedules in an office upstairs. The alert exists, but the people who need to act on it may never see it.
Context is missing. A red light tells you the line stopped. It doesn’t tell you why. Is it a material shortage, a quality defect, an equipment fault, or a safety concern? The responder has to walk to the station, find the operator, and ask. That diagnostic trip can easily add three to five minutes before any corrective action begins.
There is no built-in escalation. If a team leader responds to an andon call and can’t resolve it within a reasonable window, the issue needs to escalate to maintenance, engineering, or management. With a stack light, escalation is informal. It depends on someone remembering to make a phone call or walk to another department. Calls get missed. Response gaps widen.
There is no record. Once the light turns green again, the event is gone. Shift supervisors might jot a note on a whiteboard, but the granular data needed for root cause analysis is rarely captured with any consistency.
These gaps directly affect mean time to respond (MTTR), which in turn affects throughput, on-time delivery, and overall equipment effectiveness. When a line-stop event takes eight minutes to resolve instead of three because the right responder didn’t see the alert, those five extra minutes multiply across every incident in every shift.
What a digital andon display actually shows
The shift from a stack light to a digital screen isn’t just a format change. It’s a change in how much information the alert carries.
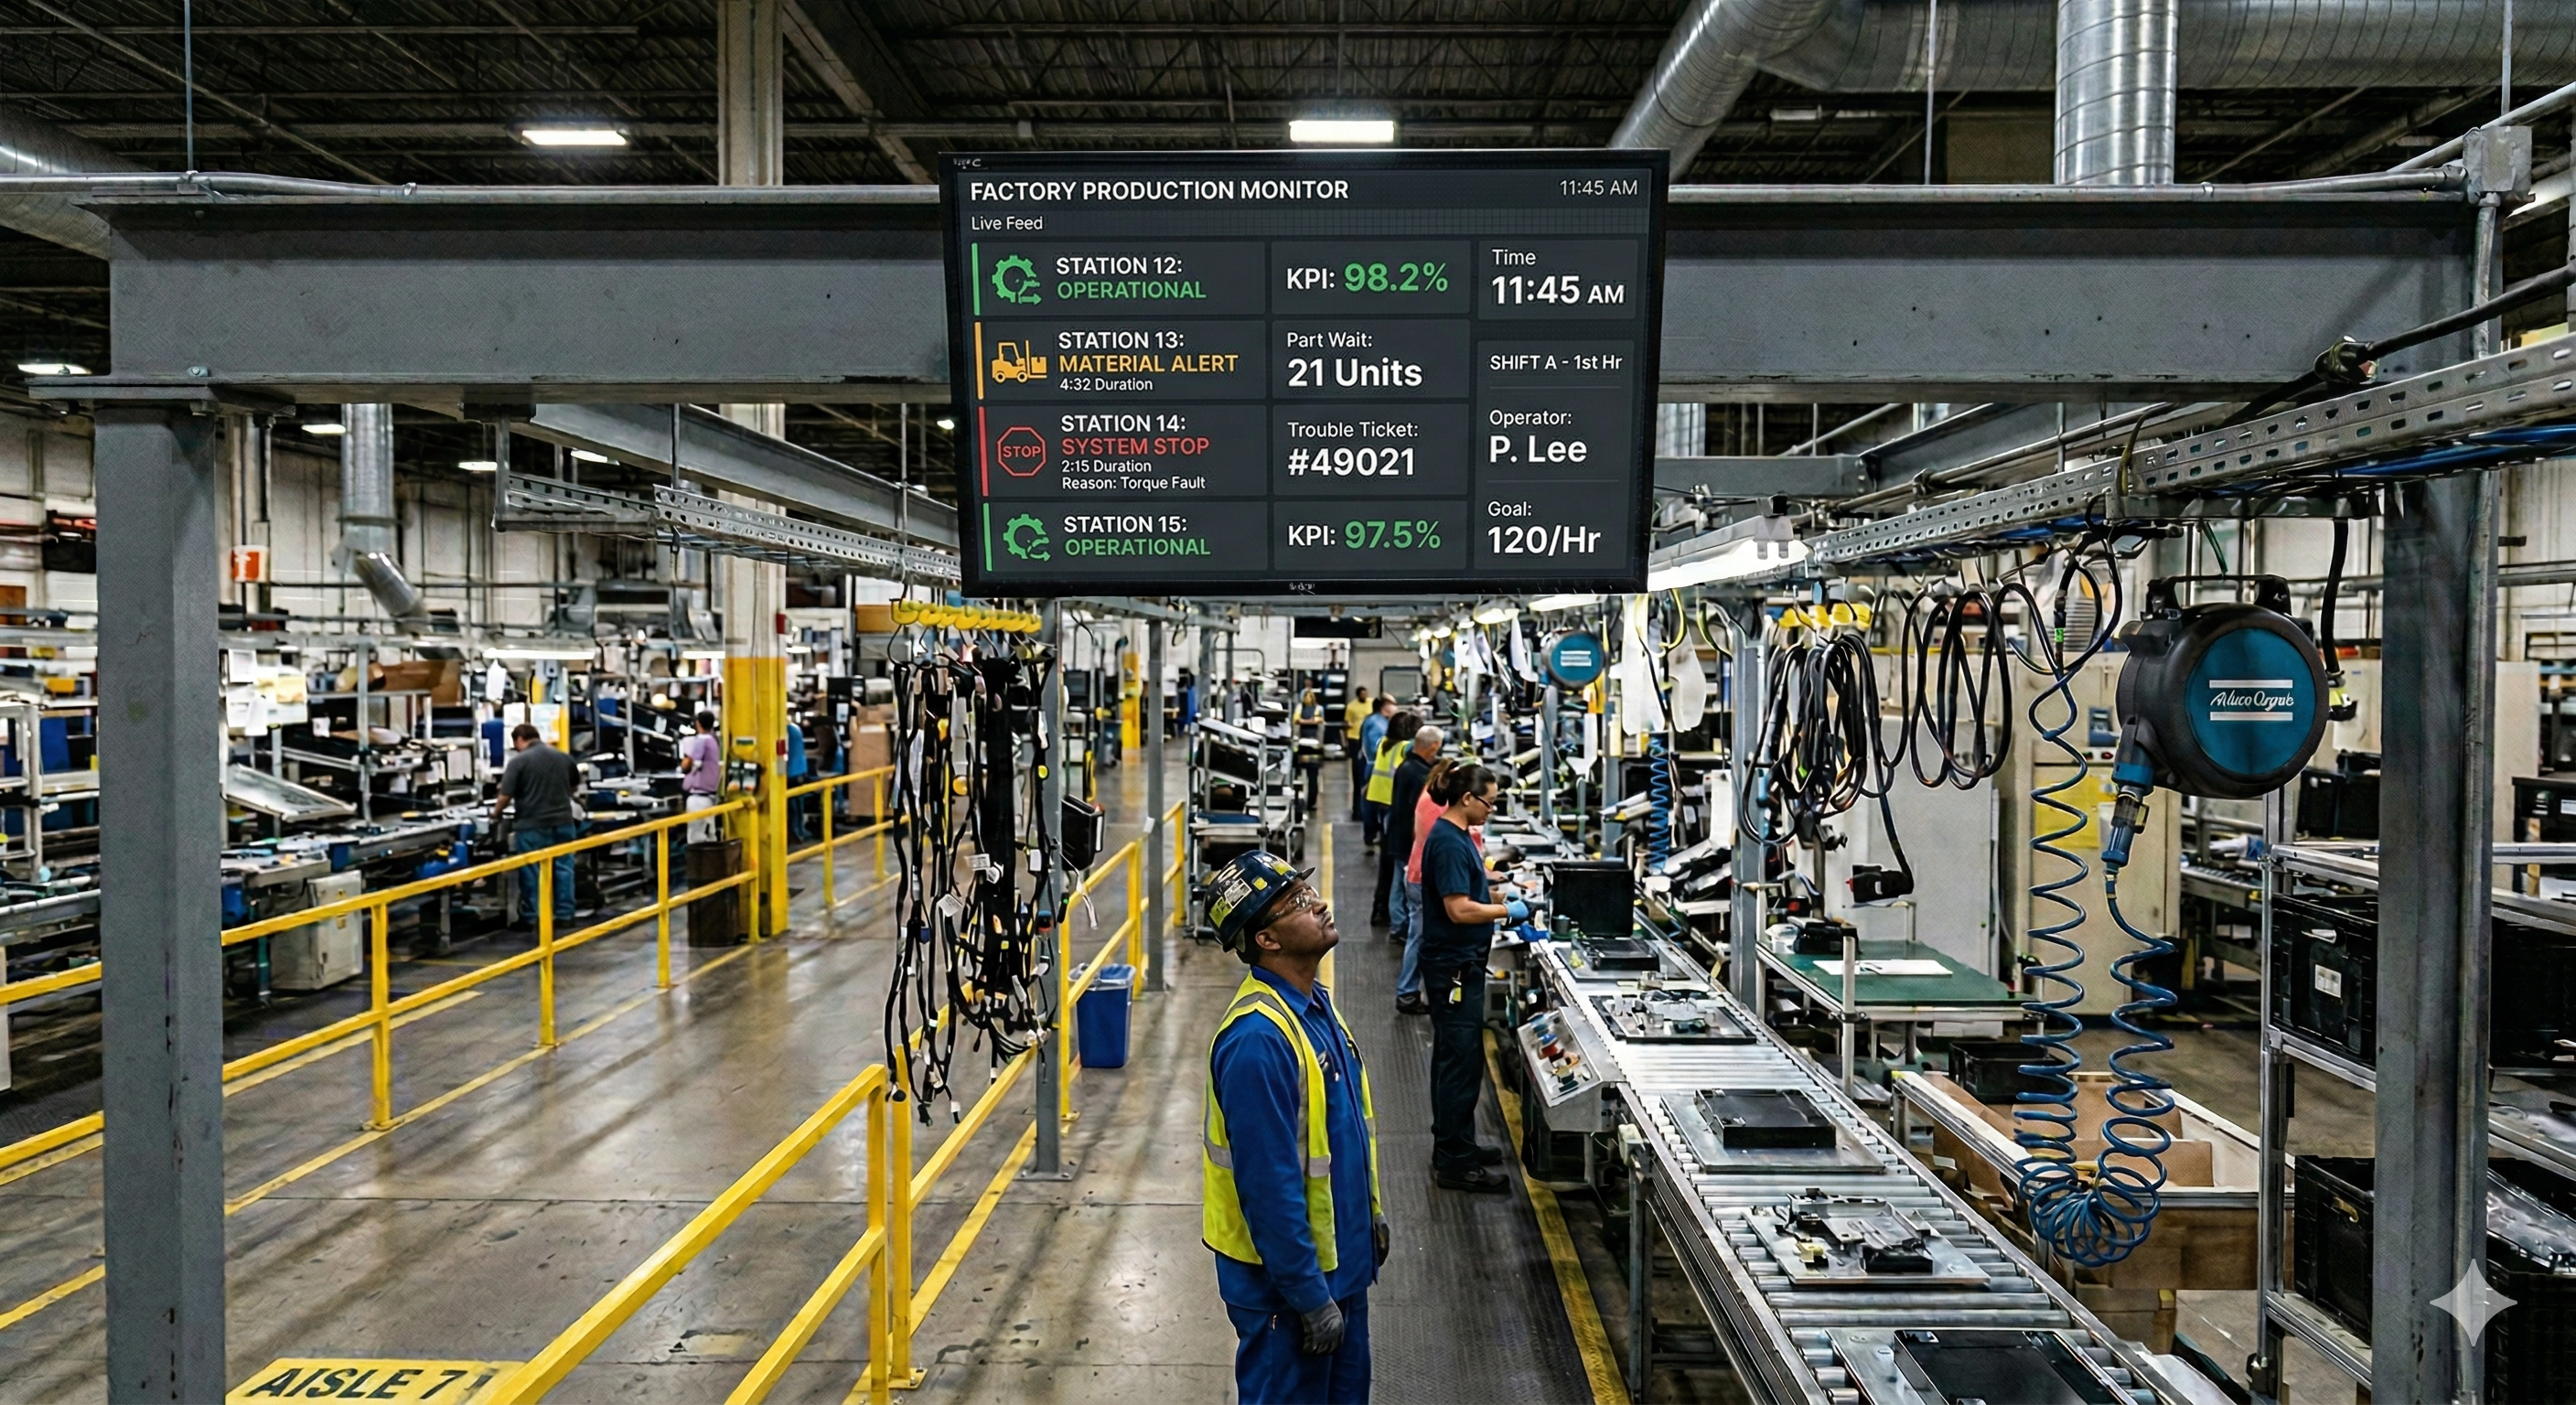
A well-designed digital andon display includes the station or machine identifier, the category of the call (quality, material, equipment, safety), a description of the specific issue, the name or role of the person who triggered the call, a running clock showing elapsed time since the call was opened, the assigned responder, and a color-coded severity indicator that changes as time thresholds are crossed.
That last element is particularly powerful. Instead of a static red light that looks the same whether the line has been down for thirty seconds or thirty minutes, a digital display can shift from yellow to orange to red as elapsed time increases. The visual urgency escalates automatically. Some implementations go further, showing a running tally of open calls across multiple lines on a single summary screen, so a production manager can glance at one display and understand the current state of the entire floor.
How digital displays reduce mean time to respond
Reducing MTTR is one of the most direct ways digital andon displays pay for themselves. Traditional andon workflows involve several time-consuming handoffs. The operator pulls the cord. The team leader sees the light, walks over, and diagnoses the problem. If they can’t fix it, they call maintenance. Maintenance arrives, asks what’s happening, and starts troubleshooting. Each handoff introduces delay and information loss.
Digital andon systems compress that sequence. The moment an operator triggers a call, the display shows the problem category and description. If the issue is an equipment fault, the maintenance technician assigned to that zone sees it immediately on the nearest screen, or receives a push notification, without waiting for a verbal relay. They already know which machine, what type of fault, and how long it’s been open before they start walking.
Plants that make this switch commonly see response times drop by 30 to 50 percent. That reduction comes almost entirely from eliminating the diagnostic lag, the gap between when a responder arrives and when they actually understand what’s happening. The elapsed-time clock adds another layer of accountability. When everyone on the floor can see that a call has been open for twelve minutes with no responder assigned, the visibility itself drives faster action.
Escalation that doesn’t depend on memory
One of the most common failure modes in traditional andon systems is the stalled escalation. A team leader responds to a call, realizes it’s beyond their scope, and means to call maintenance. Then another call comes in and the escalation never happens. The line sits idle while the issue falls through the cracks.
Digital andon platforms solve this with time-based automatic escalation. If no responder is assigned within three minutes, notify the shift supervisor. If the call is still open at ten minutes, alert the maintenance manager. If it hits twenty minutes, trigger an SMS to the operations director. These thresholds are adjustable per call category, per line, and per shift, so escalation becomes systematic rather than dependent on someone’s memory.
On the display itself, escalation is visible too. The screen shows which level the call has reached, making it clear that the issue is being actively managed, or making it painfully obvious when it’s not.
Connecting andon displays to the rest of your operation
A digital andon display is most valuable when it’s wired into the systems your plant already runs. Connected to your operational technology stack, it becomes part of a closed-loop response system.
MES integration lets the display pull context directly from your manufacturing execution system. When a call triggers, the screen can show the current work order, the product running on that line, and the batch or lot number alongside the fault code. Responders arrive with full context instead of a blinking light.
CMMS and maintenance systems like Fiix, UpKeep, or MaintainX can receive andon events as automatic work order triggers. When a call is categorized as an equipment fault, a work order is created, pre-populated with the machine ID and fault description, and assigned to the next available technician.
Historian and analytics platforms receive every andon event as a timestamped record. Over weeks and months, this data reveals which stations generate the most calls, which fault categories correlate with specific products or shift crews, and where response times consistently exceed the target. These insights feed directly into kaizen and continuous improvement programs.
Screenly for andon and line-stop displays
Screenly is built for the kind of always-on, remotely managed deployment that andon displays require. Each display is driven by a Screenly Player, which renders web-based content natively. If your andon dashboard lives in a browser, whether it’s built in Grafana, Ignition, Power BI, or a custom web application, Screenly can put it on screen.
Because Screenly supports remote management across your entire fleet, a single operations team can control what’s displayed on andon screens across multiple lines, buildings, or facilities from one cloud dashboard. There’s no need to walk the floor with a USB stick or log into each display individually.
Screenly also supports playlist-based scheduling, so your andon screens can rotate between a live status board, a shift KPI summary, and a safety message during normal operations, then switch to a full-screen alert view automatically the moment a line-stop event triggers.
Build real-time andon displays with Screenly Edge Apps
Off-the-shelf dashboards cover many andon use cases well. But some plants need displays that are tightly integrated with proprietary systems, or that behave in ways no generic tool supports. That’s where Screenly Edge Apps become essential.
Edge Apps is a developer framework that lets your engineering team build custom signage applications using standard web technologies: HTML, CSS, and JavaScript. These apps run directly on the Screenly Player hardware, so they’re fast, responsive, and continue to function even if the network connection drops temporarily. For a production environment where uptime is non-negotiable, that local execution model matters.
The real power for andon applications is in the data connectivity. Edge Apps can connect to your PLC and SCADA systems through OPC UA, MQTT, or REST APIs, subscribing to machine status tags, fault codes, and sensor readings and rendering them on screen in real time. If your plant runs Ignition by Inductive Automation, an Edge App can pull data from Ignition’s web API or tag historian. MES integration works the same way, letting you combine production-context information with PLC-level signals in a unified andon view.
What makes Edge Apps particularly well suited to andon is threshold-driven alert logic built directly into the application. If a machine’s cycle time exceeds 120 percent of the target for two consecutive cycles, switch to an amber warning. If a fault code fires, switch to red showing the description, the assigned tech, and a running timer. If the fault clears, return to the standard dashboard after a configurable cooldown. This logic runs locally on the player, so the screen reacts as fast as your data source updates, which can be sub-second over the local network.
Edge Apps also support multi-zone layouts for andon summary boards that show the status of several lines simultaneously. Each zone pulls data from a different PLC or SCADA endpoint and updates independently. If Line 3 goes into alert, its zone turns red while the other lines continue showing green, all on a single screen.
Screenly’s open-source Playground on GitHub includes example Edge Apps your team can use as starting points. Screenly handles device management, security updates, and over-the-air deployment behind the scenes, so your developers can focus on the application logic that drives value on the floor.
Measuring the impact
The business case for digital andon displays comes down to a handful of metrics that most plants already track.
Mean time to respond is the most direct indicator. Plants moving from stack lights to digital displays typically see this drop significantly, because responders are notified faster and arrive with better information. Mean time to resolve improves in parallel, because responders who arrive informed can begin corrective action immediately rather than spending the first several minutes diagnosing the problem.
Calls per shift can go in either direction, and both are useful signals. An increase early in a rollout often means operators are using the system more freely because the response is faster. Over time, as root causes are addressed, call frequency tends to decline. Escalation rate shows how often calls exceed the first response tier. A declining rate usually means first responders are better equipped to handle issues at the point of origin.
The data captured by a digital andon system also feeds directly into OEE calculations. Every andon event with a start time, end time, and category maps to the availability component of OEE. Over time, the correlation between specific fault categories and OEE losses becomes clear enough to prioritize capital and maintenance investments with confidence.
The cultural side of going digital
Technology is the easy part. The harder, more important shift is cultural. Toyota’s andon system only worked because management genuinely wanted operators to pull the cord. They celebrated stops, not because they enjoyed lost production, but because every stop was an opportunity to find and fix a root cause permanently.
Digital signage amplifies that culture in both directions. When the system is used well, the visibility reinforces the message that problems should be surfaced immediately. Operators see that their calls get fast responses. Managers see patterns that drive real improvement. But if the culture isn’t ready, the same visibility can feel punitive. If operators worry that pulling the andon will draw criticism, they’ll work around problems instead of flagging them.
The technology works best when leadership makes clear that the purpose is improvement, not surveillance. The data is there to find root causes, not to assign blame. Plants that get this right find that digital andon displays don’t just reduce downtime. They accelerate the continuous improvement cycle that lean manufacturing was built on.
Ready to see if your plant is a fit?
If your plant is still running stack lights and paper logs for andon, the gap between what you’re capturing and what you could be capturing is likely costing you more than you think. Download the free 2026-27 Digital Signage Readiness Checklist to evaluate your current infrastructure, identify integration opportunities, and see how quickly you can move to a digital andon system that actually drives faster response and lower downtime.