Every manufacturing plant has environmental limits it cannot exceed. Permissible exposure limits for airborne contaminants. Noise thresholds that trigger hearing conservation programs. Discharge concentrations tied to Clean Water Act permits. Particulate emissions capped by state air quality boards. The data behind these limits exists somewhere in every facility, usually in a monitoring system, a logbook, or a spreadsheet that someone checks at scheduled intervals.
The gap between what gets monitored and what gets seen is where problems start. An operator running a coating line doesn’t know the VOC concentration in the area ticked upward forty minutes ago. A maintenance crew replacing filters near a chemical process has no line of sight into the most recent exposure readings. The EHS manager reviewing last week’s logs spots a pattern that would have been actionable five days earlier if anyone had noticed it in real time.
Digital signage is helping manufacturing facilities catch environmental exceedances the moment they happen. By connecting screens on the production floor to the same sensor networks and monitoring platforms that already feed compliance reports, plants can make environmental data as visible and immediate as production data. And in a regulatory environment where penalties keep climbing and enforcement keeps tightening, that visibility matters.
The regulatory landscape keeps getting stricter
Environmental compliance in manufacturing has never been simple, but recent years have added layers of complexity that make passive monitoring riskier than it used to be.
The EPA raised its maximum civil penalties again in January 2025, continuing an annual trend of inflation-adjusted increases. Hazardous waste violations can now be penalized up to $93,058 per incident. CERCLA violations carry maximums of $71,545 for a first offense and $214,637 for repeat violations. These aren’t theoretical numbers. In the fourth quarter of 2025 alone, the EPA finalized 74 settlement agreements totaling over $5.2 million in fines. A Wisconsin crane manufacturer settled for $42.6 million over Clean Air Act engine certification issues. A Maryland steel manufacturer paid over $212,000 in a single quarter.
On the air quality side, fenceline monitoring requirements are expanding. New rules are pushing facilities to establish continuous monitoring using EPA-approved methods at facility boundaries, not just at emission points. The EPA’s proposed multi-sector general permit would require operators across 23 industrial sectors to monitor for 40 PFAS compounds on a quarterly basis. OSHA’s permissible exposure limits for workplace air contaminants under 29 CFR 1910.1000 set eight-hour time-weighted average ceilings that employers must track and enforce, with noise monitoring required whenever levels may exceed the 85 dBA action level.
The direction is clear. Regulators expect more data, collected more frequently, with better documentation. Facilities that rely on periodic manual checks are increasingly out of step with what enforcement agencies consider adequate.
Why periodic readings leave gaps that matter
The traditional approach to environmental monitoring in manufacturing follows a familiar rhythm. Someone walks the floor with a clipboard, takes readings from instruments at set intervals, logs the numbers, and files the results. For decades this was considered adequate. In many plants it still is the norm.
The problem is physics. Environmental conditions on a manufacturing floor don’t hold steady between readings. A batch process that runs for two hours might produce its peak emissions in a fifteen-minute window near the end of the cycle. Particulate concentrations spike when grinding operations start and fall off once filtration catches up. Noise levels surge during equipment startups and drop during scheduled breaks. Chemical vapor concentrations rise when containers are opened for transfer and dissipate once they’re sealed.
When readings happen once per shift, or once every four hours, or even once per hour, these transient events are invisible. The clipboard shows a number that was true at 10:00 a.m. and another that was true at 2:00 p.m., but it says nothing about what happened at 11:37 when a seal failure released a burst of vapor that exceeded the short-term exposure limit for twelve minutes before dissipating.
This isn’t a hypothetical risk. Continuous monitoring systems routinely capture exceedance events that discrete sampling would never detect. Laser-based particulate counters, electrochemical gas sensors, and real-time noise dosimeters all reveal spikes and patterns that only exist between the lines of a manual log. When an enforcement inspector asks to see your environmental data and you hand over a clipboard log with four readings per day, the natural question is what happened during the other twenty-three hours and forty-five minutes.
Turning monitoring systems into visible, floor-level displays
Most manufacturing facilities already have the sensors. Air quality monitors, noise meters, temperature and humidity loggers, chemical detection systems, and continuous emissions monitoring systems (CEMS) generate data around the clock. The data flows into SCADA platforms, historians, environmental management software, or cloud dashboards where EHS staff can review it.
The missing step is making that data visible to the people who work in the environment being monitored.
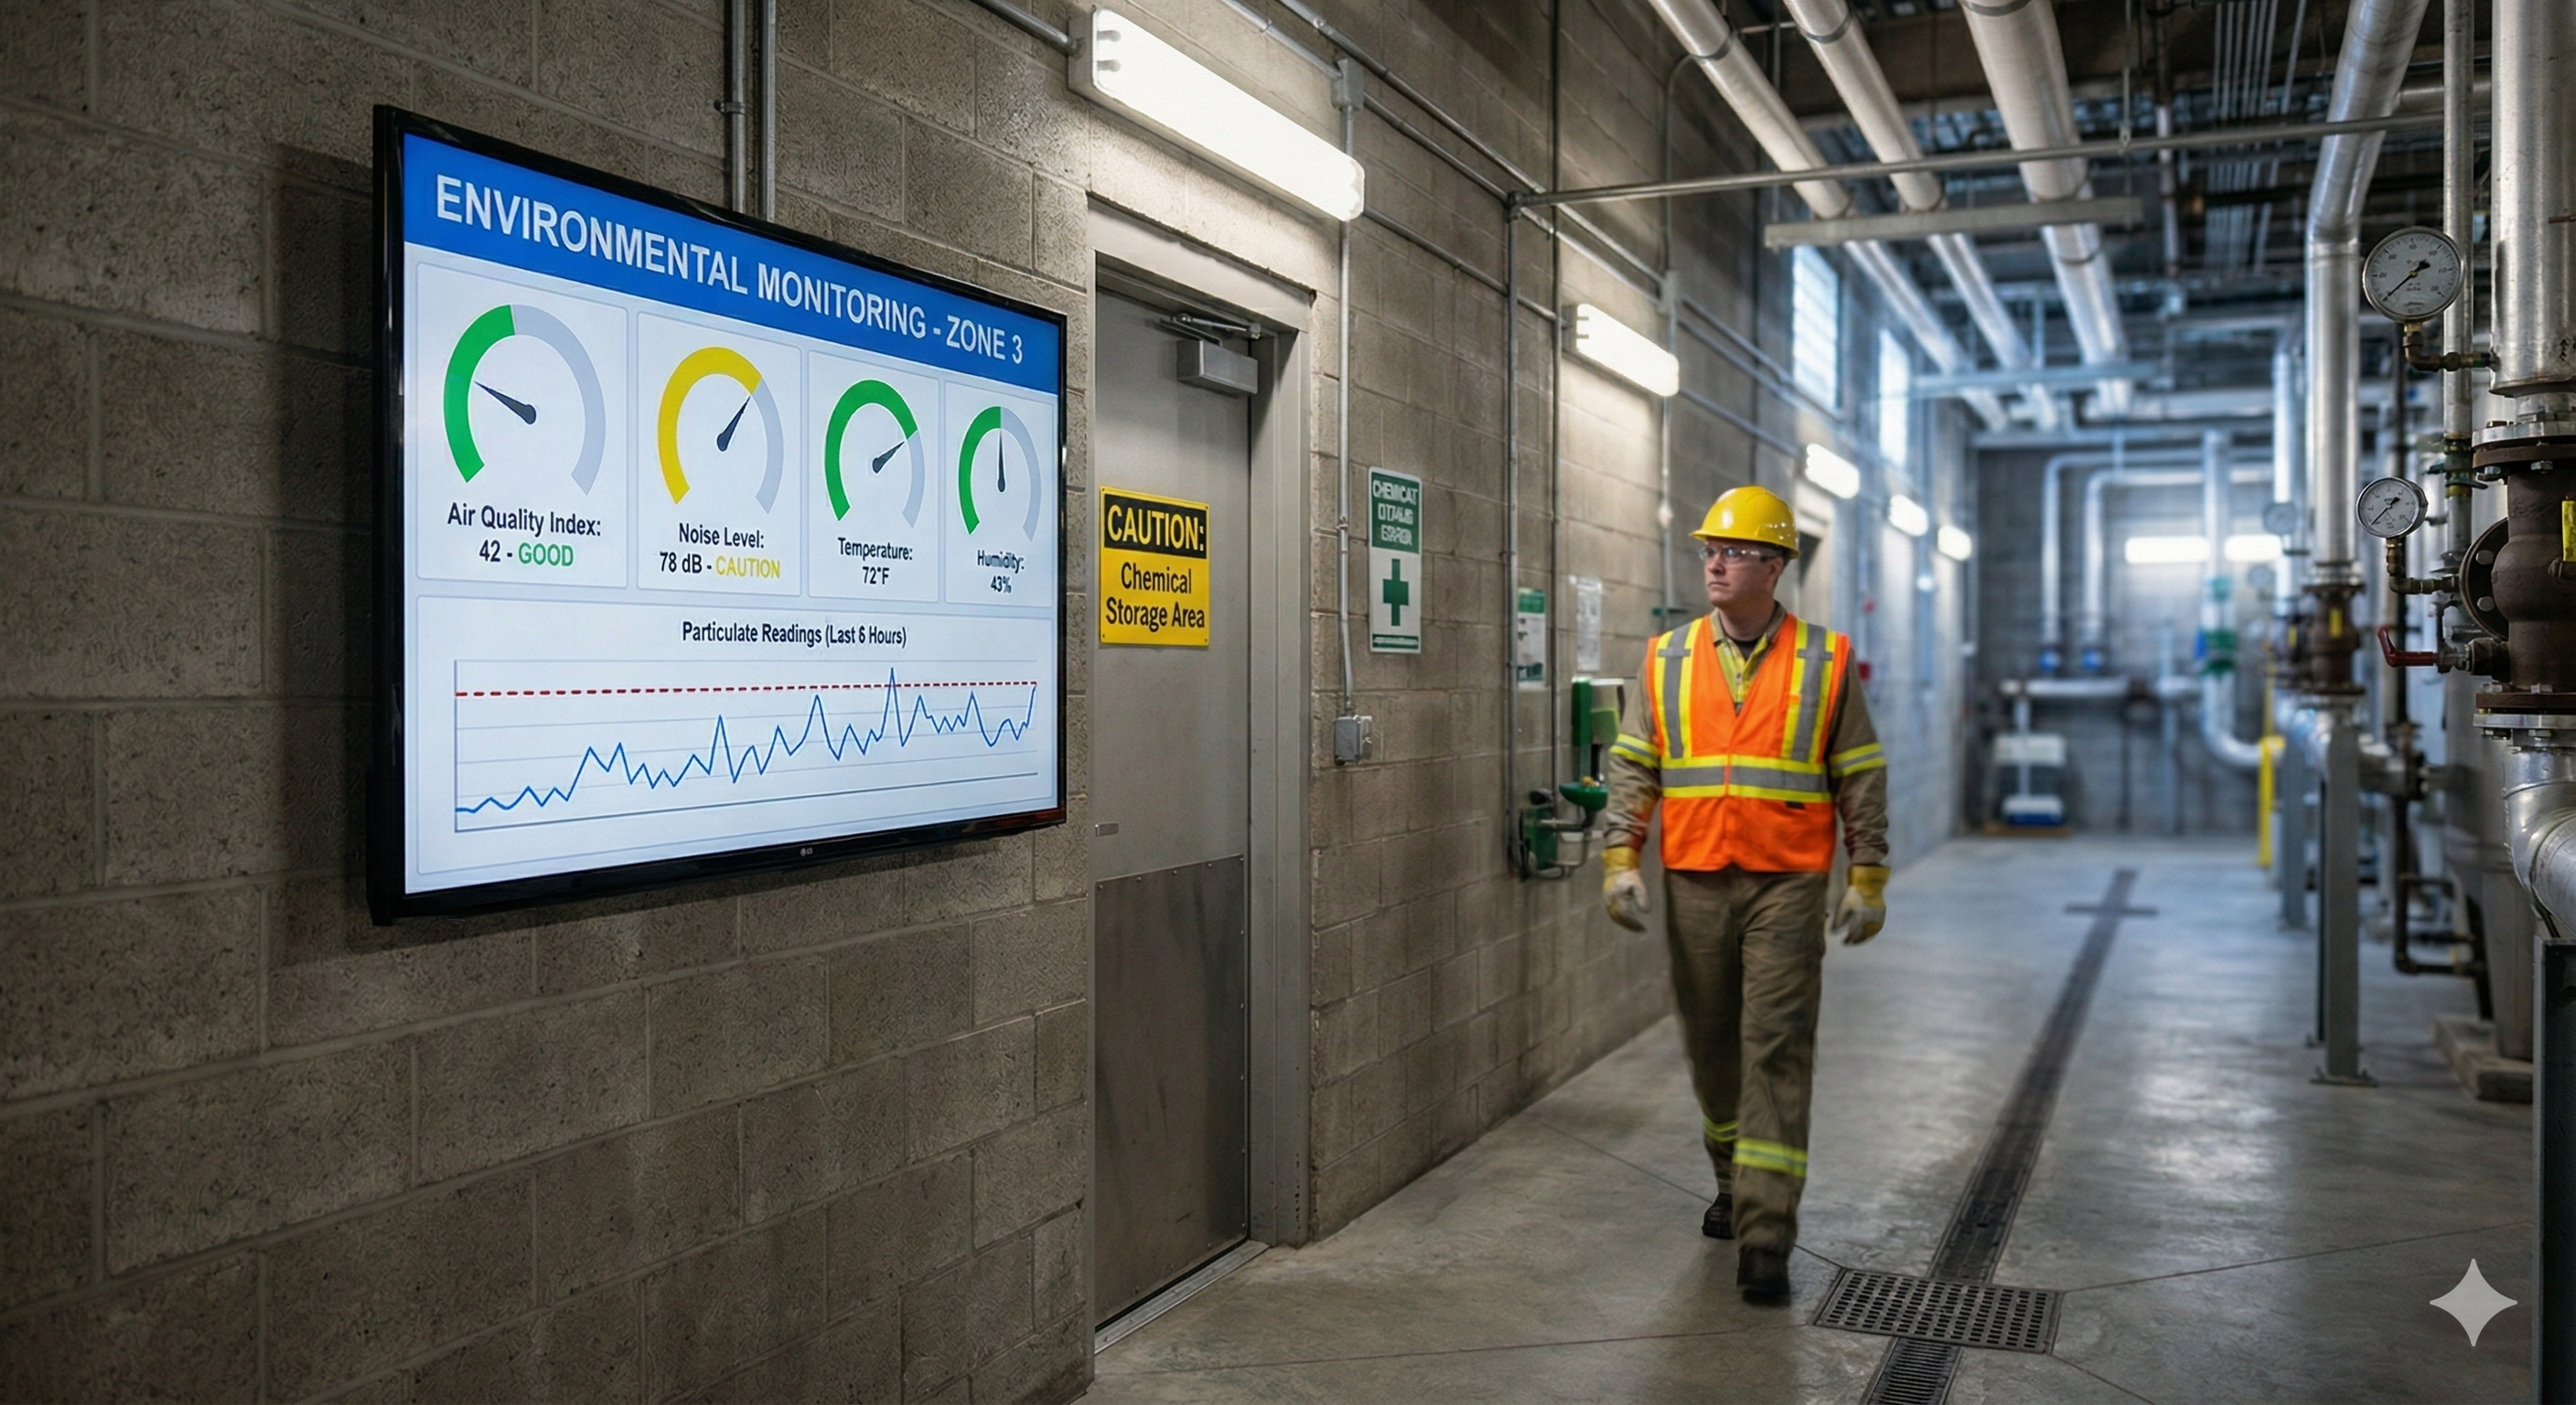
Digital signage bridges that gap. A screen mounted at a work cell can show the current ambient particulate concentration in the area, updated every few seconds, alongside the OSHA permissible exposure limit for comparison. A display near a chemical storage area can show real-time vapor detection readings from the nearest sensor. A screen at the entrance to a high-noise zone can show the current decibel level and cumulative exposure estimate for the shift.
The technical path is straightforward for plants that are already collecting environmental data digitally. If your monitoring system outputs to a web-based dashboard, a SCADA HMI, a Grafana instance, or any browser-accessible interface, that content can go directly to a Screenly-powered display. Screenly renders web content natively, so any dashboard you can open in a browser can be displayed on a screen on the floor with no additional software layer.
For plants that need more granular control over what the display shows and how it responds to changing conditions, Screenly’s Edge Apps framework allows custom applications built with standard web technologies. An Edge App can pull data from an API endpoint served by your monitoring system and render it in a layout designed specifically for floor-level visibility, with large numbers, color-coded thresholds, and automatic alert states when readings approach or exceed limits.
What belongs on an environmental monitoring display
Not every piece of environmental data needs a screen. The value of digital signage in this context comes from showing the right information to the right audience at the right location. A display in a finishing area should show data relevant to that area’s specific hazards, not a plant-wide summary that buries the local reading in an aggregate.
Effective environmental monitoring displays tend to focus on a handful of data points presented with enough context to be actionable. Current readings for the primary monitored parameter in that zone, whether that’s PM2.5 particulate concentration, total VOC levels, ambient noise, temperature, or chemical-specific sensor output, should be front and center. The corresponding regulatory or internal limit belongs right next to the reading so anyone glancing at the screen can immediately see the margin. Trend lines showing how the reading has moved over the current shift add context that a single number can’t provide, helping workers and supervisors distinguish between a stable condition and a value that’s drifting toward a threshold.
Color coding is essential. When a reading is well within limits, the display should look calm. When it approaches a warning threshold, the visual tone should shift. When it exceeds a limit, the screen should make that unmistakable. This kind of immediate visual feedback turns a passive data feed into an active alert system that doesn’t require anyone to interpret numbers under pressure.
Some plants also use their environmental displays to show permit-specific information, like the remaining allowable discharge volume for the current reporting period or the number of days since the last reportable exceedance. This kind of contextual compliance data reinforces awareness of the facility’s environmental commitments at every level of the organization, not just in the EHS office.
Building defensible compliance records with continuous visibility
One of the less obvious benefits of putting environmental data on floor displays is what it does for your compliance documentation posture. When regulators or auditors review a facility’s environmental performance, they’re looking for evidence that the facility knew what was happening in its environment and responded appropriately. A continuous data record from a monitoring system is stronger than a clipboard log. But a continuous data record combined with evidence that the data was actively displayed and visible to workers and supervisors tells a more complete story.
Digital signage creates a layer of demonstrated awareness. If your facility can show that real-time air quality data was displayed at the point of operation during every shift, that noise levels were posted at the entrance to high-exposure areas, and that chemical monitoring readings were visible to workers handling those chemicals, you’ve established that environmental conditions were not just monitored but communicated. That distinction can matter significantly during enforcement proceedings or litigation.
Manufacturing plants are using digital signage to turn environmental monitoring from a clipboard task into a real-time defense system. The screens themselves become part of the compliance narrative, evidence that the facility maintained a culture of environmental awareness and provided workers with the information they needed to recognize and respond to changing conditions.
This also supports OSHA’s general duty clause obligations. Section 5(a)(1) of the Occupational Safety and Health Act requires employers to provide a workplace free from recognized hazards likely to cause death or serious physical harm. Demonstrating that environmental hazard data was continuously visible to workers strengthens the argument that the employer took reasonable steps to keep workers informed about conditions in their work environment.
Connecting sensors and platforms through Screenly Edge Apps
The real power of using digital signage for environmental monitoring comes from the ability to connect directly to the data systems your facility already runs. Screenly Edge Apps provide a framework for building custom display applications that integrate with IoT platforms, SCADA systems, environmental monitoring sensors, and cloud-based EHS software.
Edge Apps are built with HTML, CSS, and JavaScript, the same technologies used to build any web application. For a manufacturing engineering or IT team, this means no proprietary development environment and no specialized signage programming language. If your team can build a web dashboard, they can build an Edge App.
The integration possibilities cover the full range of environmental monitoring architectures common in manufacturing. Plants running SCADA systems like Ignition, Wonderware, or FactoryTalk can expose data through OPC-UA servers or REST APIs that an Edge App consumes directly. Facilities using IoT sensor platforms like AWS IoT, Azure IoT Hub, or MQTT brokers can subscribe to environmental data topics and render readings on screen in near real time. Plants with dedicated environmental monitoring platforms can pull data through those systems’ APIs and display it alongside internal thresholds and permit limits.
Edge Apps run locally on the Screenly Player hardware, which means they continue to function even if the network connection to the cloud is temporarily interrupted. For environmental monitoring, this reliability matters. A display that goes blank during a network outage is worse than no display at all, because it creates a false impression that monitoring has stopped. With Edge Apps, the display continues to show the most recent data and can be designed to indicate clearly when it’s operating on cached data rather than a live feed.
Screenly handles device management, security updates, and over-the-air deployment of Edge Apps across your entire fleet of players. This means your EHS or engineering team can update what’s on screen across multiple facilities from a central dashboard without touching individual devices. When a permit limit changes, a new parameter needs to be added to a display, or a threshold needs to be adjusted, the update happens remotely and rolls out to every affected screen.
The open-source Screenly Playground on GitHub provides starting points and examples that teams can adapt. For environmental monitoring specifically, the pattern of fetching data from an API, comparing it against thresholds, and rendering a color-coded display with trend context is well-suited to the Edge App framework.
Practical considerations for deployment
Deploying environmental monitoring displays on a manufacturing floor involves a few practical decisions beyond the software configuration. Screen placement matters more than screen count. A single well-placed display at a work cell where a specific environmental hazard exists is more valuable than ten screens scattered through a hallway showing generic plant-wide data. Work with your EHS team to identify the locations where environmental awareness has the highest impact, typically near emission sources, chemical handling areas, high-noise zones, and areas with strict temperature or humidity requirements.
Display hardware for manufacturing environments needs to be appropriate for the conditions. Commercial-grade screens with higher brightness ratings handle well-lit production floors better than consumer TVs. Protective enclosures may be needed in areas with dust, moisture, or chemical exposure. Screenly’s hardware-agnostic approach means you can use whatever display makes sense for the environment and connect it to a Screenly Player for content delivery.
Data latency is another consideration. For most environmental monitoring applications, a refresh interval of a few seconds to a minute is more than adequate. You’re not trading stocks. You’re showing workers whether the air quality in their area is within acceptable ranges. The goal is awareness and trend visibility, not millisecond precision. Most environmental monitoring platforms can serve data at this cadence without any special configuration.
Finally, consider what happens when a screen shows a reading that exceeds a limit. The display itself is an awareness tool, not a response system. Your facility still needs defined procedures for what workers should do when they see an exceedance on screen, who to notify, whether to evacuate the area, and how to document the event. Digital signage makes the data visible. Your EHS procedures make it actionable.
A shift from reactive to preventive environmental management
Digital signage is replacing clipboard-based environmental checks in regulated manufacturing environments. The plants adopting this approach aren’t doing it because screens are novel. They’re doing it because the regulatory environment demands better data visibility, because continuous monitoring systems generate data that’s wasted if nobody sees it until a compliance review, and because showing workers their real-time environmental conditions is a straightforward way to reduce both risk and liability.
The technology stack is not exotic. Sensors you probably already own. Monitoring platforms you probably already run. Web-based dashboards you probably already have access to. Screenly provides the last piece: getting that information out of the back office and onto the floor where it can drive awareness, faster response, and stronger compliance documentation.
Environmental monitoring doesn’t have to be invisible. And with the regulatory stakes as high as they are, it probably shouldn’t be.
See where your facility stands
If your plant already collects environmental data digitally, you’re closer to a real-time floor display than you might think. Download the free 2026-27 Digital Signage Readiness Checklist to evaluate your current setup and identify what you need to go live.