Manufacturing runs on data. But if your OEE numbers don’t reach the floor until the next shift, or worse, the next morning, an entire run’s worth of lost output has already happened.
Real-time production dashboards with Screenly digital signage change that. By putting live availability, performance, and quality metrics on screens right where operators work, teams can spot problems and course-correct while it still matters.
Here’s how digital signage makes it happen, and what you need to get started.
What is an OEE dashboard (and why does it belong on the floor)?
Overall Equipment Effectiveness (OEE) measures how well a production line is performing across three dimensions: availability, performance, and quality. It’s the gold standard for understanding whether your equipment is running the way it should.
Most plants already track OEE somewhere. In a MES, a BI tool, or even a spreadsheet. The problem isn’t the data. It’s where the data lives. When metrics are locked inside a laptop or buried in an end-of-shift report, the people who can actually do something about a dip in performance never see it in time.
Floor-mounted digital displays solve that by making OEE visible to everyone, in real time, right at the point of action.
What a good floor-ready OEE display looks like
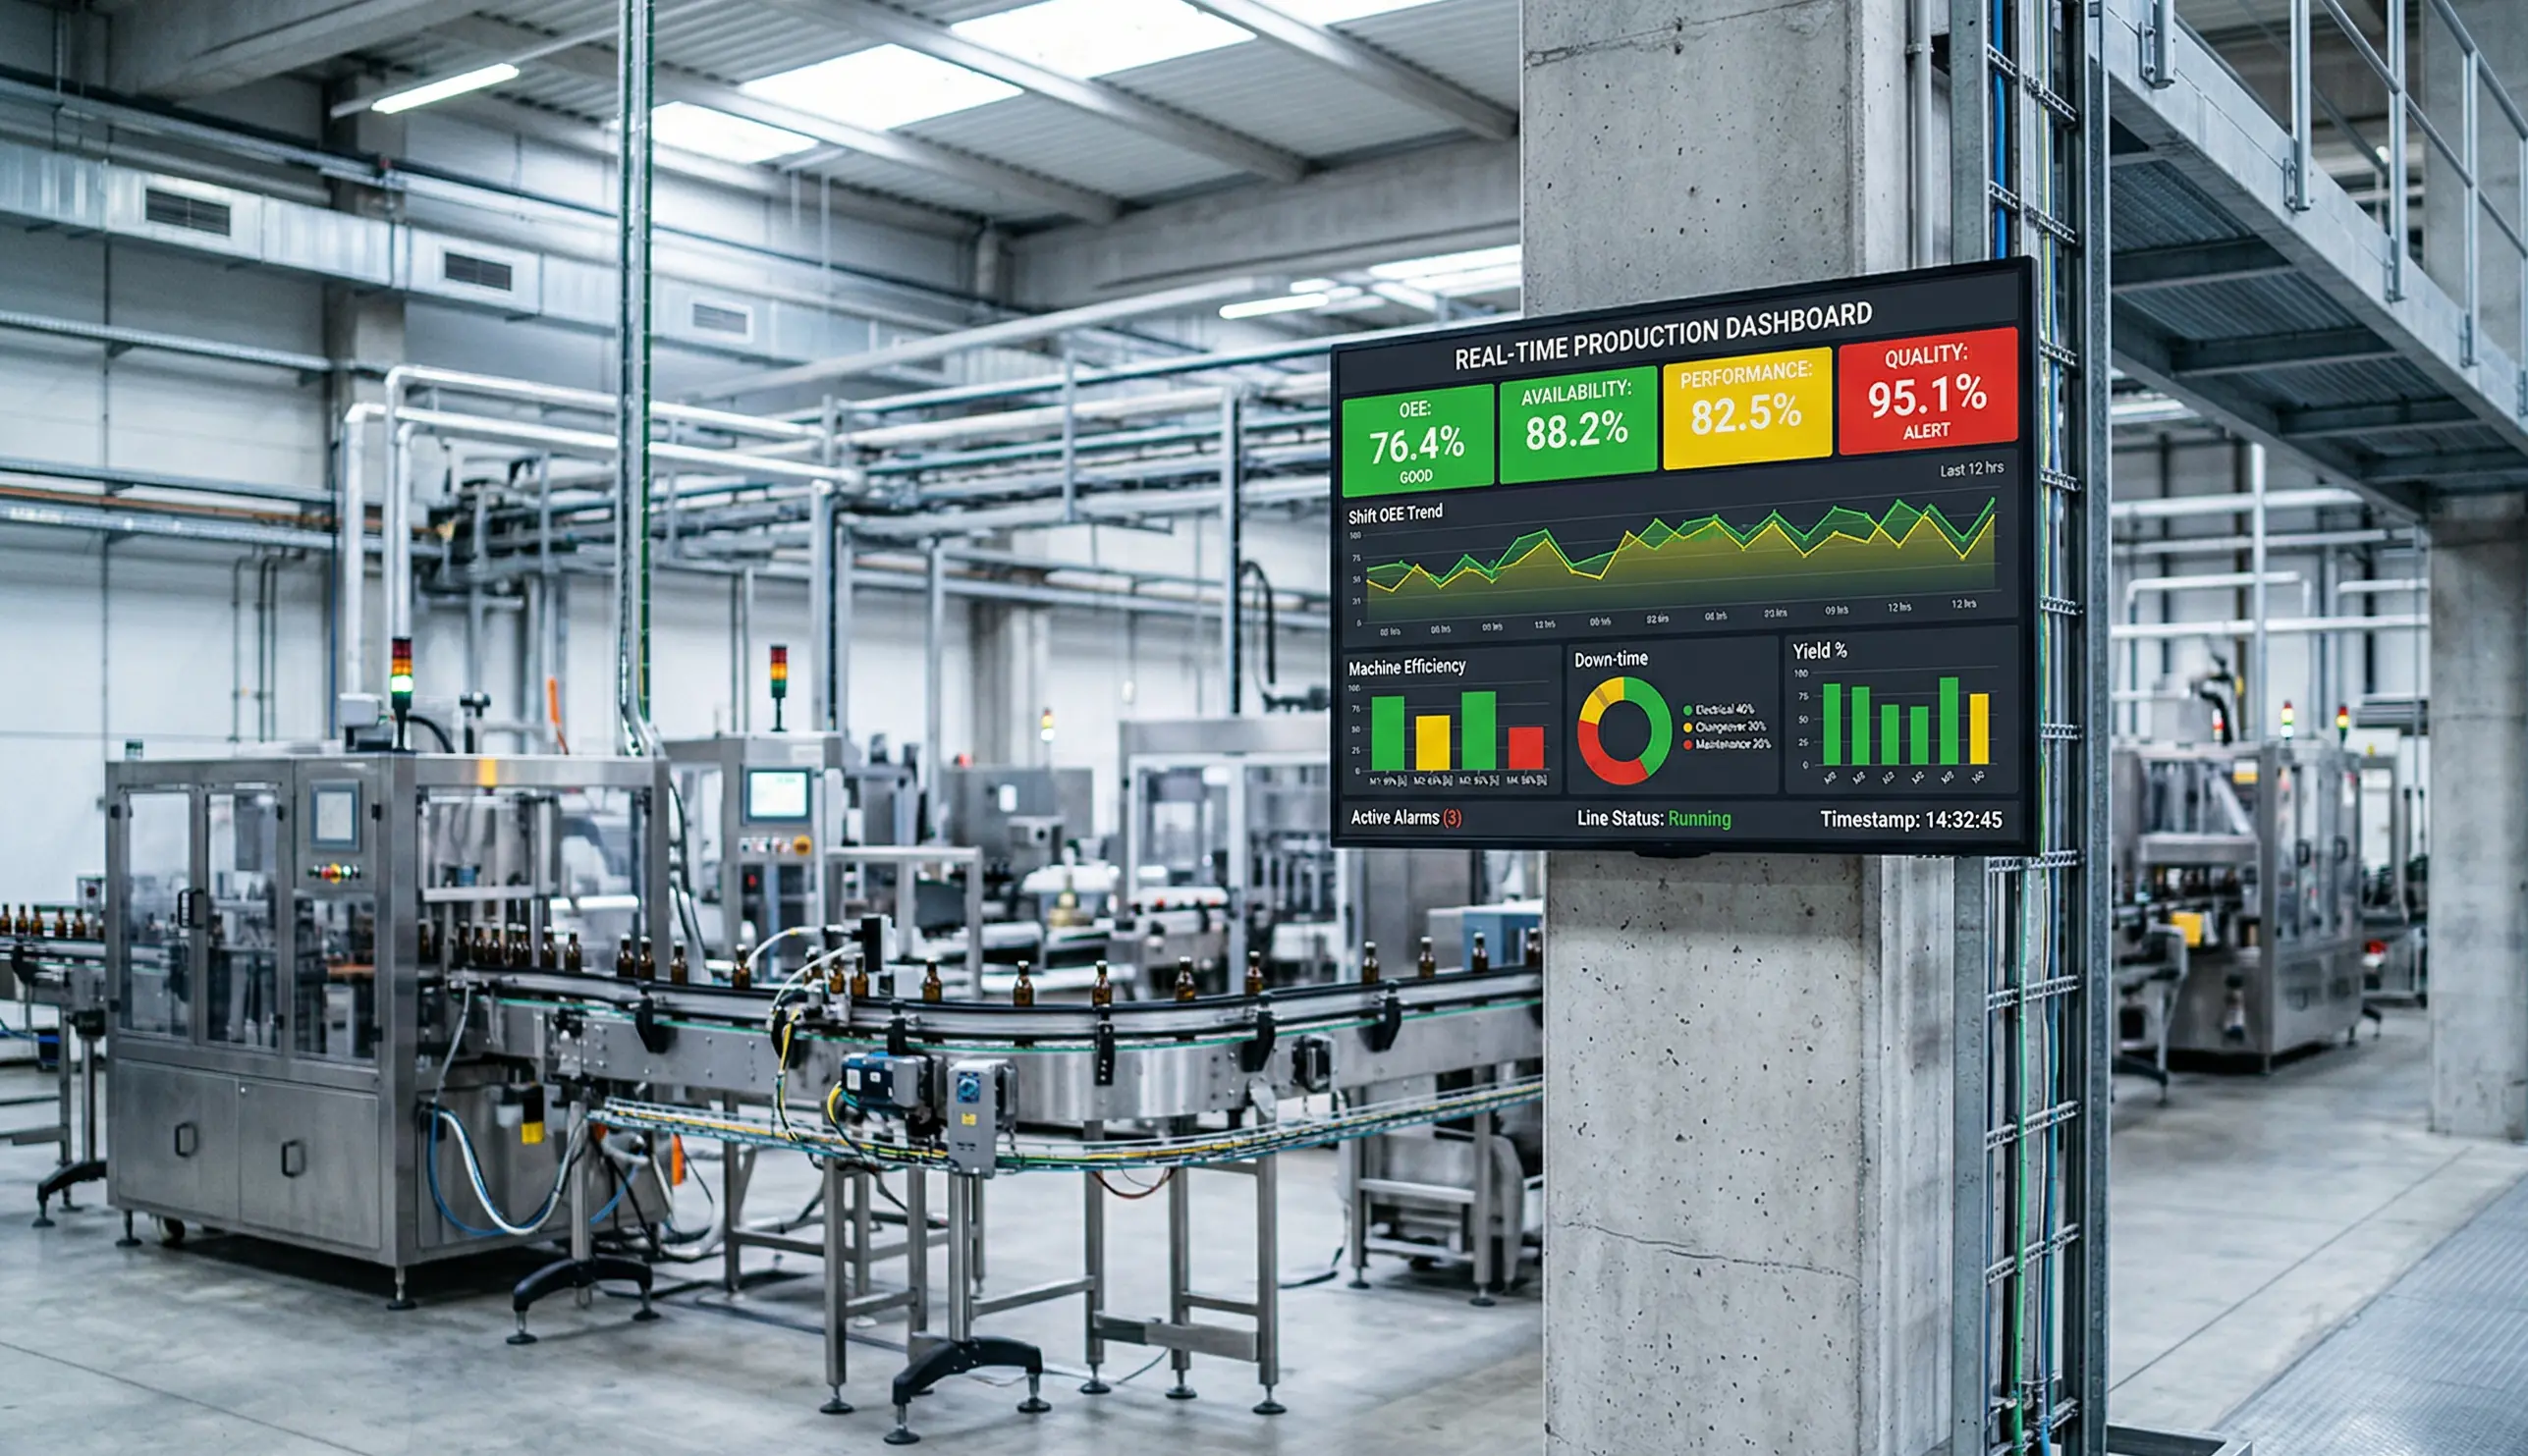
Not every dashboard translates well to a production environment. A screen on the shop floor isn’t a desktop monitor. It needs to be readable from a distance, updated continuously, and focused on what matters most.
A strong OEE display typically includes current OEE score with a clear visual indicator (green/yellow/red), availability, performance, and quality broken out individually, trend lines or shift-over-shift comparisons, target vs. actual for the current run, and downtime reason codes or alerts when something needs attention.
The key is simplicity. Operators glancing at a screen mid-task need to understand the current state in a few seconds. Save the deep-dive analytics for the office. The floor display should answer one question: are we on track right now?
How it works, from data to screen
If you’re already collecting OEE data (and most plants are), getting it onto a screen is more straightforward than you might expect. Here’s the typical setup:
Data source. Your MES, SCADA system, historian, or even a custom SQL database serves as the source of truth. Many plants also pull from IoT sensors or PLC data directly.
Dashboard tool. Tools like Grafana, Power BI, or custom web apps turn raw data into a visual dashboard. If your engineering team already has a browser-based dashboard, you’re halfway there.
Digital signage player. A device like the Screenly Player connects to your display and renders the dashboard URL on screen. It pulls the latest data automatically. No manual refresh, no USB sticks, no walking around with printouts.
Display hardware. Industrial-rated screens or commercial-grade TVs mounted where operators can see them. Size and placement matter. A 55" screen at eye level near the line beats a 24" monitor tucked in a corner.
Because Screenly renders web content natively, any browser-based dashboard can go straight to the screen. If you can open it in Chrome, you can display it with Screenly.
Why real-time beats end-of-shift
The difference between real-time and after-the-fact OEE reporting comes down to one thing: whether you can still do something about it.
When a line’s performance score starts dropping mid-shift, a live dashboard gives the operator or supervisor a chance to investigate immediately. Maybe a machine is cycling slower than spec. Maybe a changeover took longer than planned. Whatever it is, they can act now, not tomorrow.
Plants that move to real-time floor displays consistently report faster response to unplanned downtime, better shift-to-shift consistency, stronger operator engagement with performance targets, and fewer surprises in production review meetings.
It’s not magic. It’s just making information available to the right people at the right time.
Getting started with Screenly
Screenly is built for exactly this kind of deployment. The hardware is plug-and-play, the software is managed remotely, and you can go from unboxing to a live dashboard on the floor in a matter of days.
Here’s what a typical rollout looks like: mount a screen near the production line, connect a Screenly Player, point it at your dashboard URL, and manage everything (scheduling, content updates, screen grouping) from Screenly’s cloud dashboard.
No complex AV infrastructure. No dedicated IT project. And because Screenly supports remote management, your team can update what’s on screen across multiple lines or facilities without ever touching the hardware.
Build custom displays with Screenly Edge Apps
Showing a browser-based dashboard on screen is a great starting point. But what if you need something more tailored to your floor, your data, or your workflows?
That’s where Screenly Edge Apps come in. Edge Apps is a developer framework that lets your team build custom digital signage applications that run directly on the Screenly Player. They’re built with standard web technologies (HTML, CSS, JavaScript), so if your team can build a web page, they can build an Edge App.
What makes this powerful for manufacturing is the flexibility. Your team can connect Edge Apps to your existing third-party tools and databases, whether that’s a MES, a historian, a SQL database, or an IoT platform. From there, you can pull live production data and render it however you want on screen. That could be a custom OEE layout designed for a specific line, a shift summary that formats itself around your team’s KPIs, or a safety compliance board that pulls from your EHS system.
Edge Apps can also use thresholds in your data to control what displays and when. For example, you could configure an app to show a standard production dashboard under normal conditions, then automatically switch to an alert screen when OEE drops below a target or a machine goes down. The logic lives in the app, so the screen reacts to your data in real time without anyone needing to intervene.
Because Edge Apps run locally on the player, they’re fast and reliable. They continue to work even if your internet connection drops, which matters in production environments where uptime is everything. Screenly also handles security, device management, and over-the-air updates behind the scenes, so your developers can focus on the application logic that actually drives value on the floor.
Screenly’s open-source Playground on GitHub has ready-made Edge App examples you can use as starting points or customize for your own setup. If your team has specific needs that off-the-shelf dashboards can’t meet, Edge Apps give you a way to build exactly what the floor needs.
Ready to see if your plant is a fit?
If you’re already tracking OEE digitally, you’re closer to a live floor display than you think. Download the free 2026-27 Digital Signage Readiness Checklist to find out what you need to go live and how quickly you can get there.