
As long-time Grafana users, we’re pleased to announce that Screenly now supports Grafana. Internally, we have used Grafana to visualize both our technical and business metrics. However, until now, there was no easy way to render Grafana dashboards on Screenly powered digital signage. That all changes today. Since Grafana is more or less the de facto standard dashboard for most modern tech companies, we’re excited to be the first digital signage company to add support for Grafana.
What is Grafana?
(If you’re already familiar with Grafana, you can skip this paragraph.)
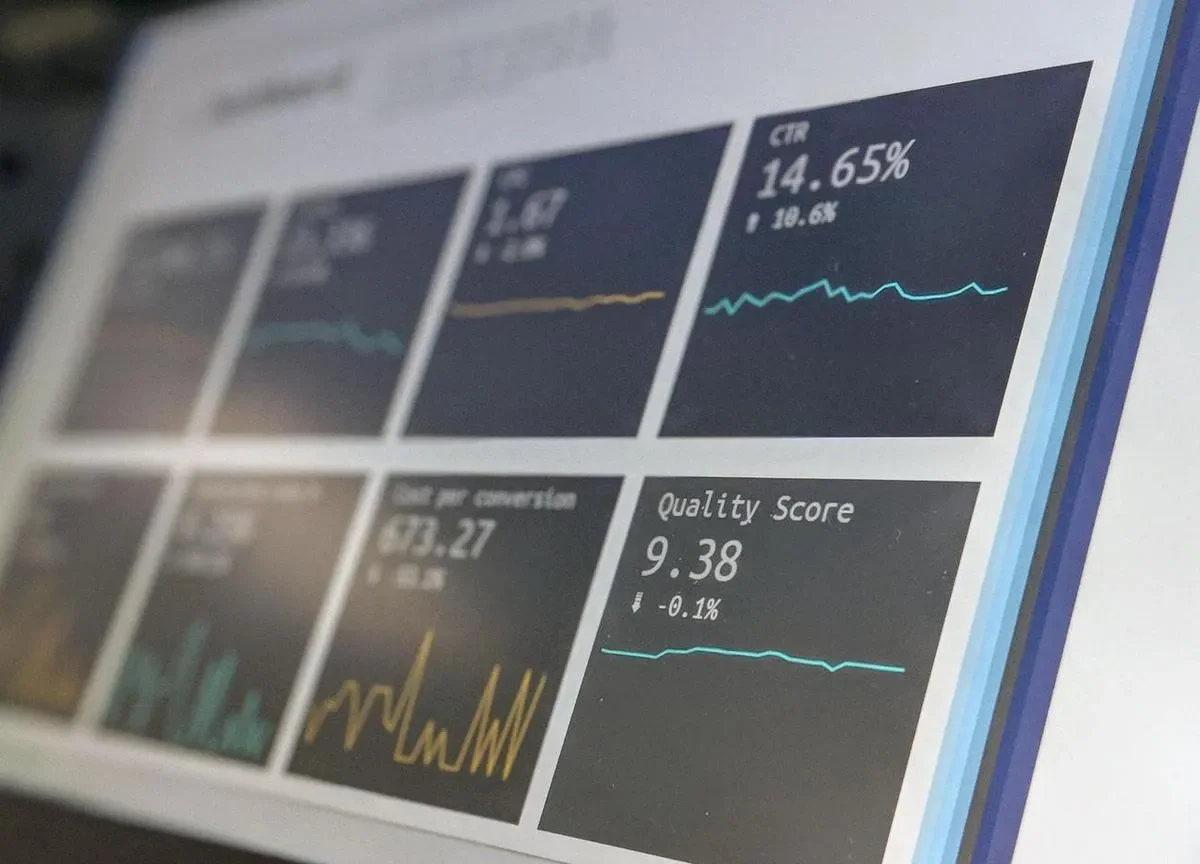
Grafana allows teams to create dashboard and graph visualizations from their data. In the last few years, it has emerged as the standard for data visualization in the Docker and Kubernetes world. Thanks to its broad range of accepted data sources and active ecosystem of dashboard templates, Grafana has positioned itself as a powerful player among dashboard tools. Using Grafana, you can visualize data from sources such as Prometheus, Graphite, InfluxDB, and openTSDB. You can even overlay data from multiple sources onto the same graph. Also, users can configure Grafana to trigger alerts when metrics rise above or fall below a certain pre-determined threshold. Users can send these alerts to a variety of tools, such as Slack, Pagerduty, VictorOps, OpsGenie, and also run-of-the-mill email.
Why Screenly and Grafana make a great combo
Since this feature is something that we’ve had in the making for a while now, we’ve had a fair amount of time to speak to companies around the globe on how they are using Grafana. We were primarily interested to know how they display Grafana on their office wall screens. As it turns out, most companies are just using a regular PC to push content to the digital display. However, a handful of companies are already using Raspberry Pis.
What they all had in common, however, was the fact that they didn’t have a good way to manage their digital screens. Management usually consisted of ssh-ing into the device to change things. Since a regular browser was used to control the player, they either used a physical keyboard/mouse or VNC/TeamViewer to both log in to Grafana and to control what was displayed. Then, every time they got logged out or wanted to change anything, they had to then log into each of their displays to update the content. Needless to say, this wasn’t a great user experience.
Enter Screenly. Screenly allows you to manage a fleet of screens displaying Grafana dashboards all from a central web interface. Screenly simplifies how users authenticate their digital signage screens with Grafana. Since Screenly carries out authentication via API tokens (that Screenly pushes out centrally), there is no need to log in to each device manually. If you need to rotate the credentials, you only need to do it once, and Screenly automatically federates the credentials to each screen.
Because many Grafana installations are only accessible within the corporate network, it’s important to note that Screenly does support this use case too. As long as the Screenly players can communicate with the Grafana installation, you’re good to go. There’s no need for the Grafana installation to be publicly available (but it works fine even if it is of course).
It’s also worth pointing out that Screenly automatically applies security updates to your digital signage players so that you can focus on more important things.
How remote teams can use Grafana and Screenly
As you may know, Screenly is a 100% remote company. We don’t have offices, and our team is literally spread across continents. We use tools like Trello, Phabricator, and Appear.in to keep everyone on the same page and working in tandem. Accordingly, we don’t have a centralized location for a digital display dashboard. Instead, everyone has a 7" screen on their desk (we use the 7" official Raspberry Pi touchscreen in our case). On this display, everyone can see his or her relevant metrics in real time. We have some shared graphs that span across the entire company, and we also have specific dashboards for different teams, such as the development and sales teams.
For more information, see our article How to use Screenly with Grafana.