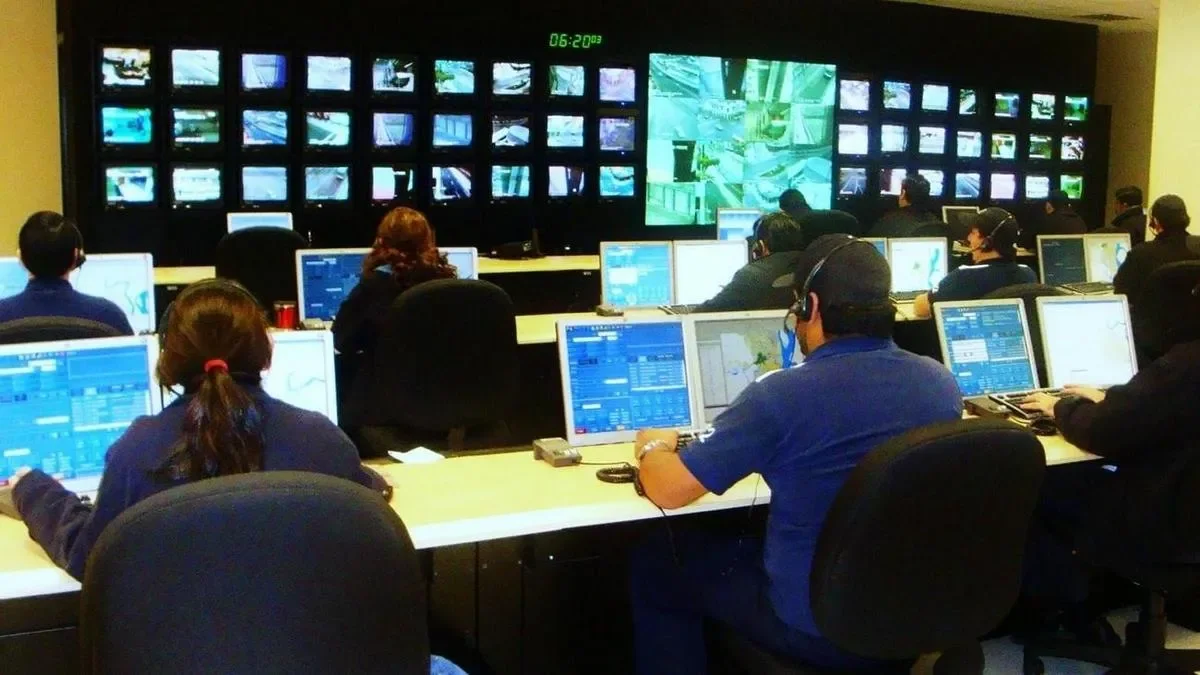

Tracking key performance indicators (KPIs) over time is vital for managing a successful call center. A call center can be a hectic environment – a lot of noise, a lot of agents, and the ever-present demand of the telephone. Without call center KPI tracking, the call center environment can quickly devolve into a frustrating mess where neither customers nor employees are happy. In this article, we detail several KPIs that are useful for running a successful call center. Additionally, we also detail how you can display these call center KPIs on a digital sign in order to keep business metrics top-of-mind for your entire team.
Average time in queue
When a customer calls your business’s number, they wait in a queue before an agent handles their call. We’ve all waited on a call center queue, and sitting on the phone listening to recycled elevator music is certainly not an enjoyable experience. Measuring the average time in queue can help your team address common call center management questions such as, “Do I have enough agents?” and “Are my agents as productive as they can be?” If your call center’s average time in queue is increasing, perhaps it is time to hire more agents or time to provide your existing agents with more tools to help them be more productive. If your call center’s average time in queue increases and management does nothing about this change, customers will grow frustrated with your call center, and they may take their business elsewhere.
Call abandonment rate
The call abandonment rate is the number of calls where a customer hangs up before reaching an agent divided by the total number of calls that come into a call center. The call abandonment rate typically has a direct relationship with the average time in queue, and this makes sense, as more customers will hang up the longer they have to wait. In an ideal world, the call abandonment rate would be zero. In practice, it is important to get this number as close to zero as possible, as an abandoned call is likely a customer that is lost forever. Management can address a high call abandonment rate by reducing the average time in queue or by implementing a more robust automated help desk solution.
Average calls per agent
The average calls per agent is a great metric to help assess the productivity of each team member. There will inevitably be an agent with more calls than everyone else, and there will also inevitably be an agent with fewer calls than everyone else. The agent with the lowest call volume likely needs to pick up the pace, and the agent with the highest call volume probably needs to spend more time on the phone with customers. Tracking the calls per agent and comparing this data across team members will help teams identify outliers and provide needed coaching when an agent’s numbers cross particular thresholds.
Average call time per agent
Management can use the average call time per agent in conjunction with the average calls per agent for assessing an agent’s productivity. For example, if an agent has a low average call volume and a high average call time, then the agent may need to speed up their conversations with customers. On the other hand, if an agent has a low average call volume and also a low average call time, the agent may be less productive and more easily distracted. As with average calls per agent, use average call time per agent to help address differences in call center agent performance.
Call resolution rate
Of course, the main goal of a call center is to assist customers. Even if agents answer every call within a second and each agent performs at peak productivity, a call center does not fulfill its function if it does not provide resolutions to customer problems. One way to track a call center’s performance on this goal is by tracking the call resolution rate. This KPI is simply the number of calls where agents and customer reached a resolution divided by the total number of calls. If your call center’s call resolution rate is decreasing over time, perhaps employees have not received enough training on how to solve common customer problems. Ideally, your call center agents will be able to address and solve the problems of each customer who calls.
How to display call center KPIs on a digital sign
To get the most improvement to your team’s performance by measuring call center KPIs, you must ensure that call center agents regularly see these KPIs and are always aware of the team’s collective performance. One way to do this is by installing a digital sign in a common area within your office. This way, your team can assess performance at a glance. To set up a digital sign in your office, you will need a digital signage player. This device renders your digital signage content to your display screen. You will also need digital signage software, which allows you to update your digital sign’s content easily.
Next, you will need a data visualization tool to calculate and display your KPI data. Google Sheets for digital signs and Grafana for digital signs are great data visualizations tools that are compatible with digital signs. Take a look at our page on digital signage dashboards to find a variety of other useful tools for KPI dashboards. To get started with your call center KPI digital sign, sign up for a Screenly cloud account.